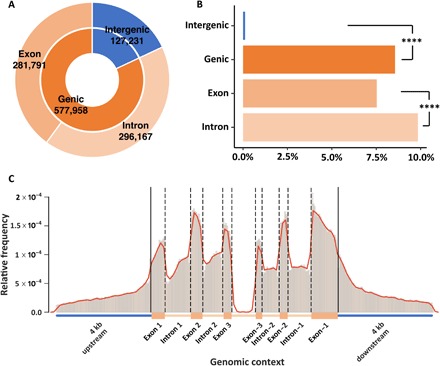
Fig. 1. DNA methylation landscape.

(A) Relative distribution of methylated CpGs across intergenic (18%), genic (82%), intronic (42%), and exonic (40%) regions in the Aiptasia genome. (B) Normalized frequencies of methylated CpGs in different regions. Chi-square test shows significant differences between intergenic and genic regions and between exons and introns (****P < 0.0001). (C) Relative frequencies of methylated positions across a normalized gene model. All frequencies were normalized to the lengths of the corresponding regions.
