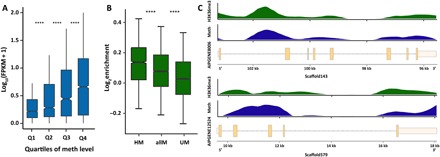
Fig. 2. DNA methylation is associated with higher expression.

(A) Gene expression is positively correlated with median methylation levels. t test P values are 7.65 × 10⁻²¹, 3.75 × 10⁻¹⁴, and 1.75 × 10⁻¹³ for Q1 (first quartile) and Q2 of methylation (meth) levels, Q2 and Q3, and Q3 and Q4, respectively. FPKM, fragments per kilobase per million mapped fragments. ****P < 0.0001. (B) ChIP-seq analysis of H3K36me3 signals shows significant enrichment in methylated genes. t test P values are 2.48 × 10⁻²⁰ for highly methylated genes (HM) and all methylated genes (allM) and 1.06 × 10−72 for unmethylated genes (UM) and all methylated genes. Highly methylated genes show the strongest enrichment of H3K36me3, followed by all methylated genes. In contrast, unmethylated genes show only weak enrichment of H3K36me3 over input controls. ****P < 0.0001. (C) Distribution of H3K36me3 enrichment and DNA methylation levels across two exemplary gene models. H3K36me3 and DNA methylation show coinciding distribution patterns over genes.
