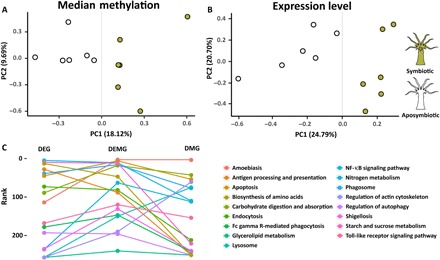
Fig. 4. PCA and KEGG pathway enrichment analysis.

(A and B) PCA of gene expression and median methylation levels of Aiptasia genes. Both gene expression and DNA methylation separate samples by symbiosis state. PC1, first principal component; PC2, second principal component. (C) KEGG pathway enrichment analysis of previously identified symbiosis-related pathways. The y axis shows the ranks of these pathways in the pathway enrichment analyses of DEGs, DEMGs, and DMGs, respectively. The combined set of DEMG provides significant lower P values (front ranks) for symbiosis-related pathways. NF-κB, nuclear factor κB.
