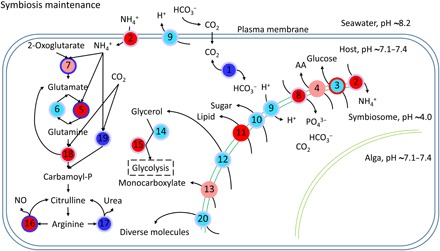
Fig. 6. Schematic diagram of symbiosis maintenance–associated genes.

Every node represents a category of genes and generally has multiple corresponding genes. The inside colors of nodes represent the expression changes of corresponding genes, including non-DEGs (cyan), up-regulated (red), down-regulated (blue), and up-regulated and down-regulated DEGs (light red). The colors of node edges represent the methylation level changes of corresponding genes, including non-DMGs (light blue), hypermethylated (red), hypomethylated (blue), and hypermethylated and hypomethylated DMGs (light red). Numbers in circles denote genes/proteins: 1, carbonic anhydrase (CA); 2, ammonium transporter; 3, glucose transporter; 4, amino acid transporter; 5, glutamine synthetase; 6, glutamate synthase; 7, glutamate dehydrogenase; 8, phosphate transporter; 9, V-type proton ATPase; 10, sugar transporter; 11, lipid transfer protein; 12, aquaporin 3 (glycerol transporter); 13, monocarboxylate transporter; 14, alcohol dehydrogenase; 15, aldehyde dehydrogenase; 16, NOS; 17, arginase; 18, carbamoyl-phosphate synthase/aspartate carbamoyltransferase/dihydroorotase; 19, carbamoyl-phosphate synthase (ammonia); 20, ABC transporter.
