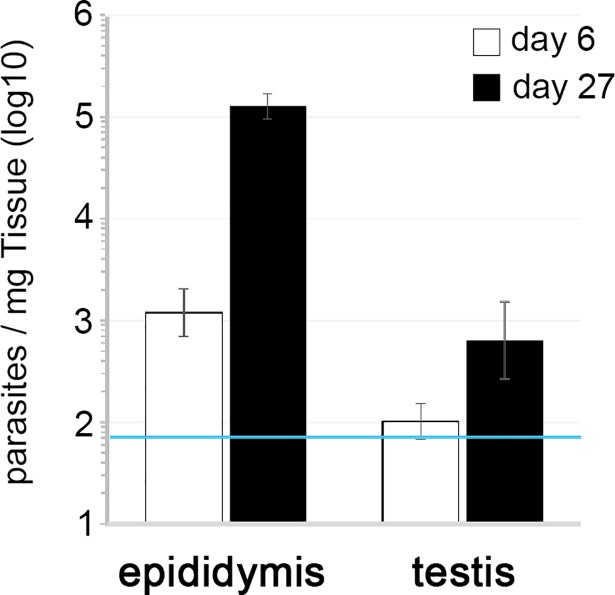
Fig 3. Parasite density in the male reproductive system.
Parasite density in epididymis and testis of infected animals on days 6 and 27 post-infection was quantified by qPCR of gDNA (T. brucei 18s rDNA normalized to the weight of the tissue/organ). The blue line corresponds to the detection threshold, which is the background amplification obtained from non-infected animals. Represented are the geometric means and the respective standard errors. N = 6–9 mice per time-point (n = 3 for control, non-infected mice). Statistical significance was assessed using Wilcoxon rank sum and Wilcoxon signed rank tests.

