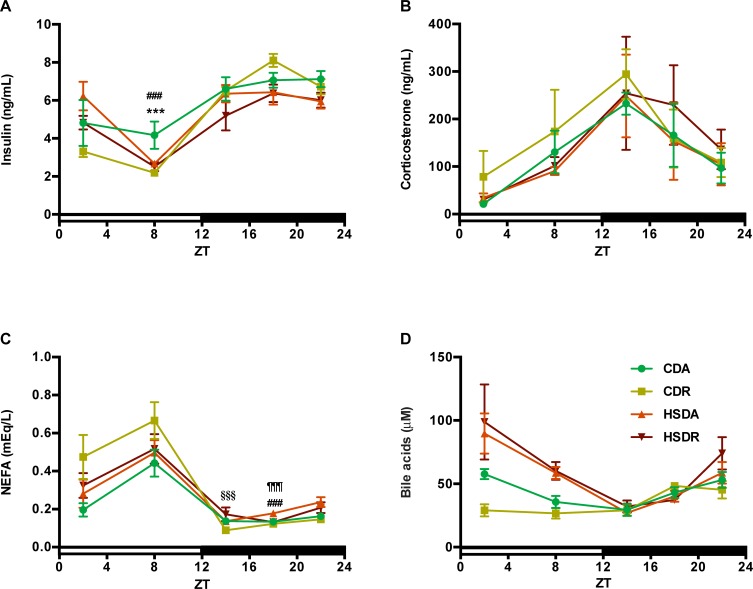
Fig 5. Blood parameters including insulin, corticosterone, non-esterified fatty acid and bile acids, changed little under HSD.
Diurnal variations of blood insulin (A), corticosterone (B), non-esterified fatty acid (NEFA) (C) and bile acids (D) in the end of experiment are shown here. Values are means ± SEM, n = 4 at each data point. Statistical results of two-way ANOVA are indicated in S4 Table. 0.05 represents for significant changes and NS means not significant. When the interaction is significant, Student’s t test using the residual mean square was performed: *** indicated the values differed significantly (p<0.001) between CDA and CDR groups; ### indicated the values differed significantly (p<0.001) between CDA and HSDA groups; §§§ indicated the values differed significantly (p<0.001) between CDR and HSDR groups; ¶¶¶ indicated the values differed significantly (p<0.001) between HSAD and HSDR groups.

