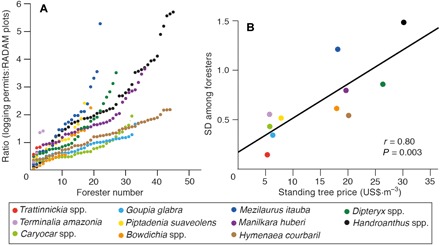
Fig. 3. Distribution of potentially fraudulent logging permits and overestimation variation among foresters.

Distribution of the average ratio of timber volume in logging permits to RADAM plots (that is, plots surveyed through the national forest inventory of Brazil) of each forester in charge of logging permit, ordered from lowest to highest ratio for each species group on the x axis (A), and positive correlation between the SD of the ratios associated with different foresters and timber price of standing trees (B).
