
Fig. 5. Synthetic matrix enhances engraftment in dystrophic muscle trauma.
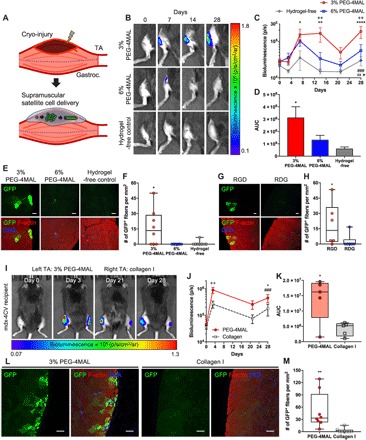
(A) Schematic of injury and cell delivery. We applied cryo-injury on the surface of TA muscle. We supramuscularly delivered freshly isolated MuSCs in media (hydrogel-free) or encapsulated in hydrogel. Gastroc., gastrocnemius muscles. (B) Representative IVIS images of mdx-4CV mouse hindlimbs treated with cell-laden 3% 20-kDa PEG-4MAL, 6% 20-kDa PEG-4MAL, or media (12,500 MuSCs per TA). (C) Quantification of bioluminescence over time. Mean ± SEM. n = 8 per condition. *P < 0.05, **P < 0.01, and ****P < 0.0001 versus hydrogel-free via Tukey’s test within time. ++P < 0.01 versus 6% PEG-4MAL via Tukey’s test within time. ⋆P < 0.05 for interactions, xxP < 0.01 for biomaterials effect, and ###P < 0.001 for time effect via two-way repeated-measures ANOVA. (D) Quantification of area under the bioluminescence curve (AUC). Mean ± SEM. n = 8 per condition. *P < 0.05 versus hydrogel-free via one-way ANOVA with Tukey’s test. (E) Representative cross sections of TA muscles treated with cell-laden 3% 20-kDa PEG-4MAL, 6% 20-kDa PEG-4MAL, or media on day 28 after transplantation. Scale bars, 50 μm. (F) Quantification of GFP+ fibers per square millimiter. n = 8 per condition. *P < 0.05 versus all groups via Kruskal-Wallis with Dunn’s test. (G) Representative cross sections of TA muscles treated with cell-laden 3% 20-kDa PEG-4MAL functionalized with RGD or RDG peptides at day 28 after transplantation (12,500 MuSCs per TA). Scale bars, 50 μm. (H) Quantification of GFP+ fibers per square millimeter. n = 6 per condition. *P < 0.05 via two-tailed Mann-Whitney U test. (I) Representative IVIS images of MuSC-transplanted mdx-4CV mice. TA muscles were cryo-injured, and 20,000 MuSCs were delivered to the injured TA muscles in either PEG-4MAL hydrogel (left) or collagen gel (2.7 mg ml−1; right). (J) Quantification of bioluminescence over time. Mean ± SEM. n = 5 per condition. ++P < 0.01 within time via Sidak’s test. *P < 0.05 for interactions and biomaterials effect via two-way repeated-measures ANOVA. ###P < 0.05 for time effect via two-way repeated-measures ANOVA. (K) Quantification of AUC. n = 8 per condition. *P < 0.05 via two-tailed paired t test. (L) Representative cross sections of TA muscles treated with 50,000 MuSCs in either PEG-4MAL or collagen gel (2.7 mg ml−1). Scale bars, 100 μm. (M) Quantification of engrafted GFP+ fibers per square millimeter. n = 8 per condition. **P < 0.01 via two-tailed Wilcoxon matched-pairs signed-rank test.