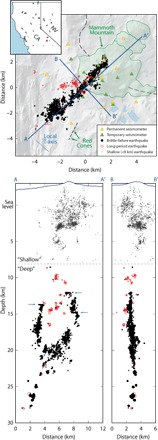
Fig. 1. Map and cross-sectional views of relocated seismicity.

(Top) Map view of deep (8 km+) relocated seismicity. Epicenters fall along a NE striking zone. The outline of dome complex is shaded, and the black dashed line corresponds to the topographic outline of Long Valley Caldera (10). The blue dashed line corresponds to local least compressive stress (T axis) from shallow focal mechanisms (11). (Bottom) Depth cross sections parallel (A-A′) and perpendicular (B-B′) to the NE trend in seismicity. The structure is vertical, with two arms surrounding a nearly aseismic core that hosts most of LP earthquakes. Horizontal features are denoted with arrows. Below 8 km, symbol size scales with magnitude.
