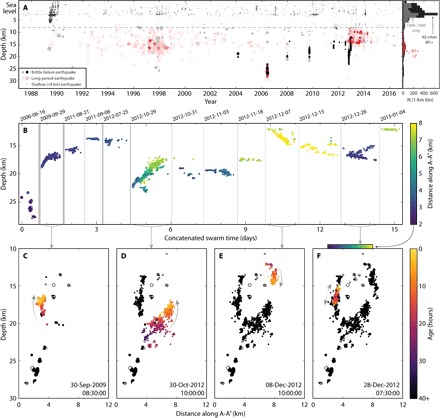
Fig. 2. Spatiotemporal history of deep seismicity.

(A) Earthquake occurrence in the past 30 years by depth. Cataloged but not relocated seismicity is plotted at lower opacity. Shallow earthquakes are limited to >M1. Histogram at right bins M1+ earthquakes by depth, colored by type. (B) Expanded view of swarms with 20+ events illustrating migration in depth with time. Successive swarms are concatenated, with time between swarms removed; swarms are separated by vertical bars of thickness that scale to the amount of time removed, and start dates are listed along the top. Color is by location along A-A′ to highlight activity between branches; the color bar is copied below for reference to location within the cross section. (C to F) Views along A-A′ for four large swarms [arrows connecting from (B)] with color denoting time since date in the lower corner corresponding to the end of each swarm; arrows guide direction of migration over time.
