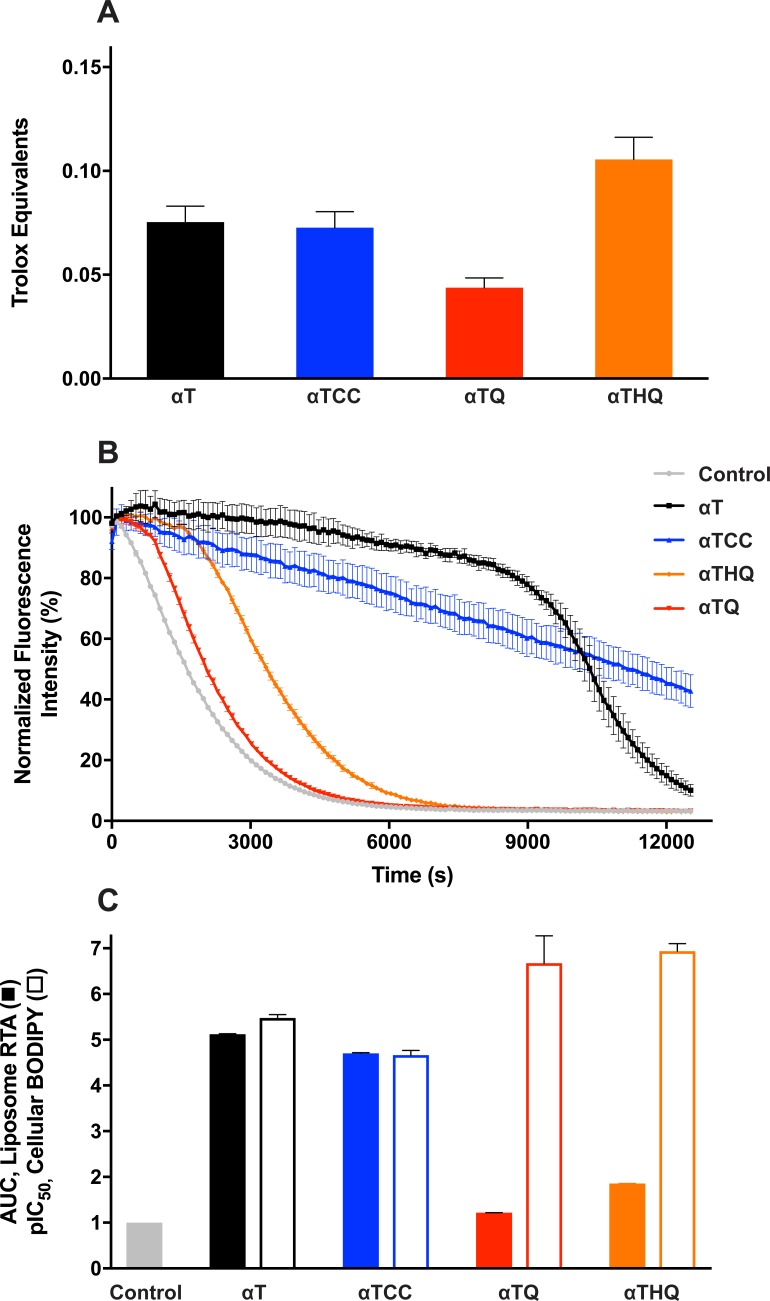
Fig 4. Oxygen radical absorbance capacity (ORAC) and radical-trapping antioxidant (RTA) activity assays with αT, αTCC, αTQ, αTHQ in comparison with their ferroptosis rescue potency.
(A) ORAC activity of each compound compared to Trolox. Mean ± SEM (N = 6) displayed. (B) Overlay of kinetics of RTA activity of each compound (50 μM) prepared as 2 mol% in DOPC liposomes, detected through quenching of BODIPY™ 581/591 C11 (0.5 μM) emission at 600 nm. Mean ± SD (N = 3) displayed. (C) Comparison of RTA BODIPY quenching area-under-the-curve (AUC) of each compound (relative to the Control group, defined as 1) and pIC50 values for inhibition of RSL3-induced cellular BODIPY oxidation. Mean + SEM displayed; N = 3 for RTA assay, N = 6 for cell BODIPY assay.

