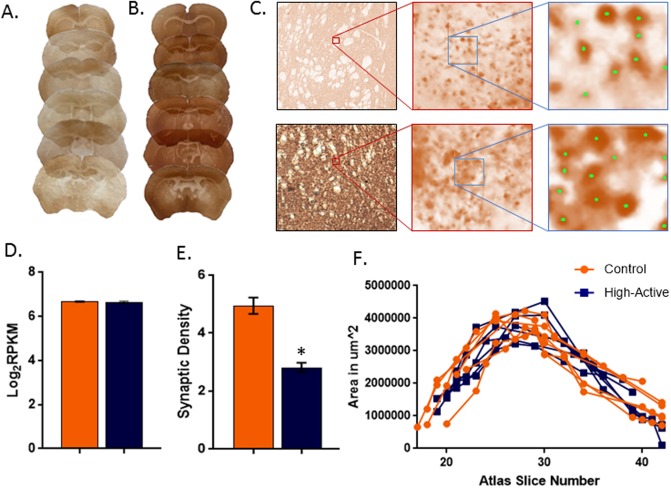
Fig 5. Reduced synaptophysin labeling in High-Active relative to Control mice.
A. Representative sections from High-Active (left column) and Control (right column) mice. A section from each mouse in the study is shown at different positions along the rostro-caudal axis. Zoomed in images of B. High-Active and C. Control striatum at 2.5x magnification and 100x magnification, with a further zoomed in image of the counting frame with sample counts (green). Left and bottom boundaries of the counting frame are exclusion boundaries, and top and right are inclusion boundaries. D. Average synaptophysin gene expression in the striatum from the RNA-seq dataset showing no difference between genotypes. E. Mean (± SE) density of synaptophysin positive particles (number of particles x107 per mm3) in High-Active and Control mice showing significant reduction in High-Active. F. Unilateral, two-dimensional areas of the striatum plotted against section number (based on the mouse brain atlas [28]) for each animal separately showing no difference between genotypes.

