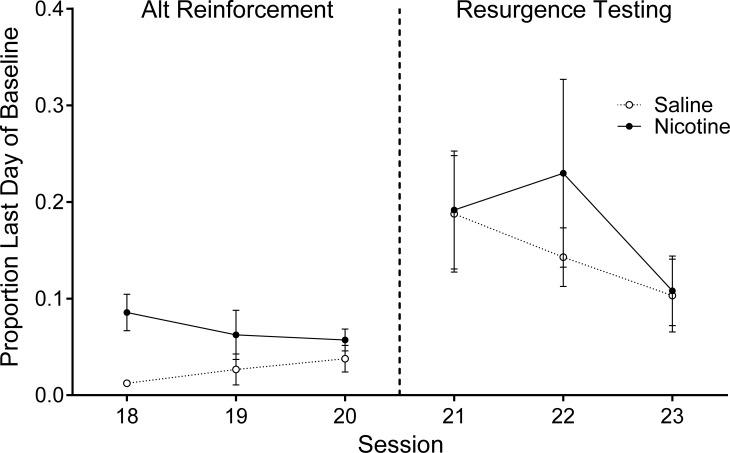
Fig 3. Average proportion of Baseline Target (alcohol) lever responses plotted as a function of session for the Nicotine and Saline groups.
Data are plotted for the last three days of the Alternative Reinforcement Phase (left) and the three days of Resurgence Testing (right). Filled circles represent data for the Nicotine group and open circles represent data for the Saline group. Error bars represent standard error of the mean.

