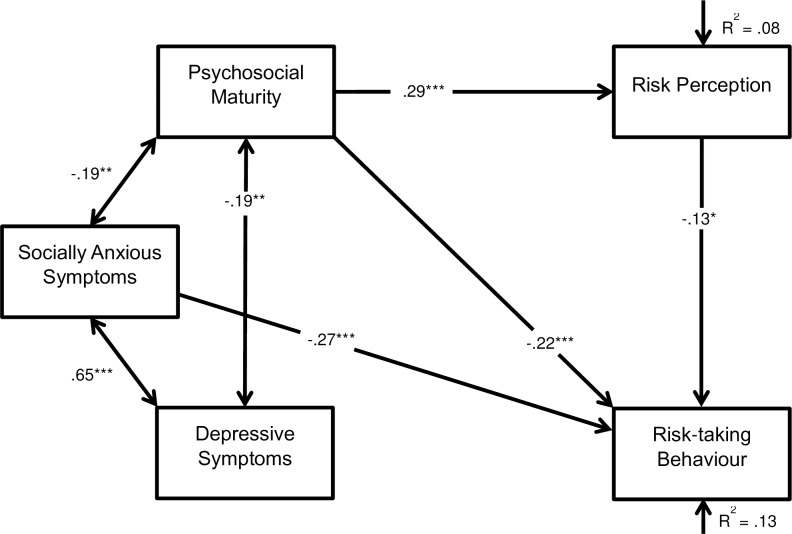
Fig 3. Path model 2 displaying the associations between risk-taking behaviour, depressive and socially anxious symptoms, psychosocial maturity, and risk perception.
Boxes represent observed variables, long arrows represent regressions, double headed arrows represent correlations, short arrows represent residual error variances, and values represent standardised effect sizes. *p < .05, **p < .01 ***p < .001. R2 represents the amount of variance explained by the model.

