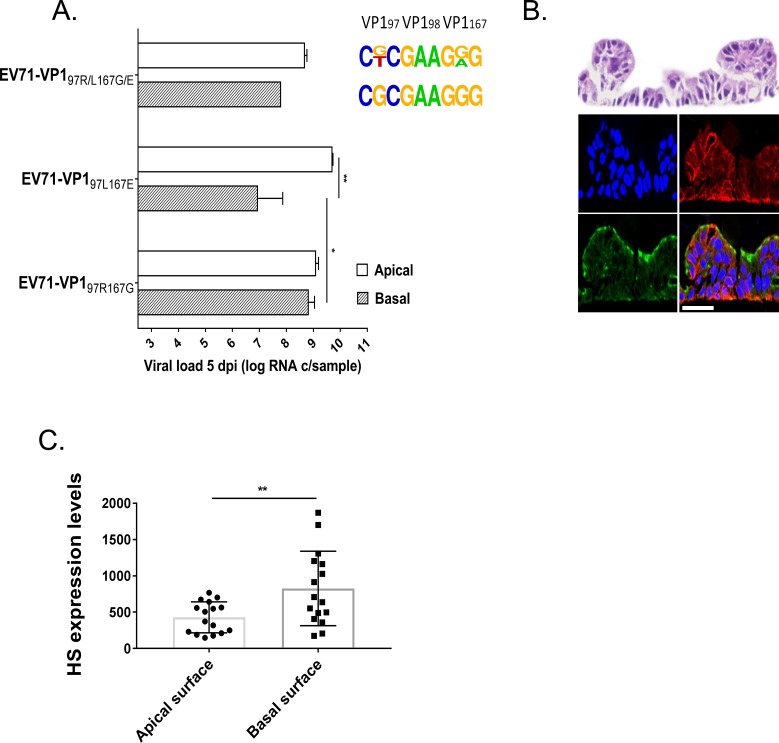
Fig 5.
Replication of EV71-VP197R167G, EV71-VP197L167E and EV71-VP197R/L167G/E in reconstituted small intestine tissues (A) and HS/SCARB2 expression in the same tissues (B and C). (A) Viral loads were measured by RT-qPCR 5 dpi in the apically collected washes of the apically or basally inoculated tissues and are expressed as the mean (±SEM) N = 2. **P<0.01, *P<0.05. The frequency plots are shown on the right (see Fig 3 for details) (B) Tissue sections were colored with hematoxylin and eosin (upper panel) or labeled by immunofluorescence. SCARB2 is stained in green, HS in red and cell nuclei in blue. Scale bar = 20 μm. (C) Quantification of HS expression at the apical and basal surface of intestinal tissues was achieved through an analysis using MetaMorph software based on the immunofluorescence labeling of HS attachment receptor in sectioned tissues.

