. 2018 Aug 15;7:e37558. doi: 10.7554/eLife.37558

Figure 3. Comparison of the structures of the Kv chimera solved in detergent by X-ray crystallography and in lipid nanodiscs by single-particle cryo-EM.

(A) The X-ray structure (PDB entry 2r9r) is shown in the overlapping cryo-EM maps with fitting of the transmembrane region to the map. Notice the slight displacement/shift of the X-ray structure is most pronounced in the cytosolic β subunit. (B) Final model refined against the cryo-EM maps is shown with the maps. (C) The structural difference between the X-ray structure and the cryo-EM structure is illustrated with the backbone atom RMSD values (0.096–5.759 Å). α subunits were used for superpositioning of the two structures. (D) The superpositioning of the X-ray (gold) and cryo-EM (purple) structure with the close-up views of the transmembrane (I) and cytosolic (II) domains.

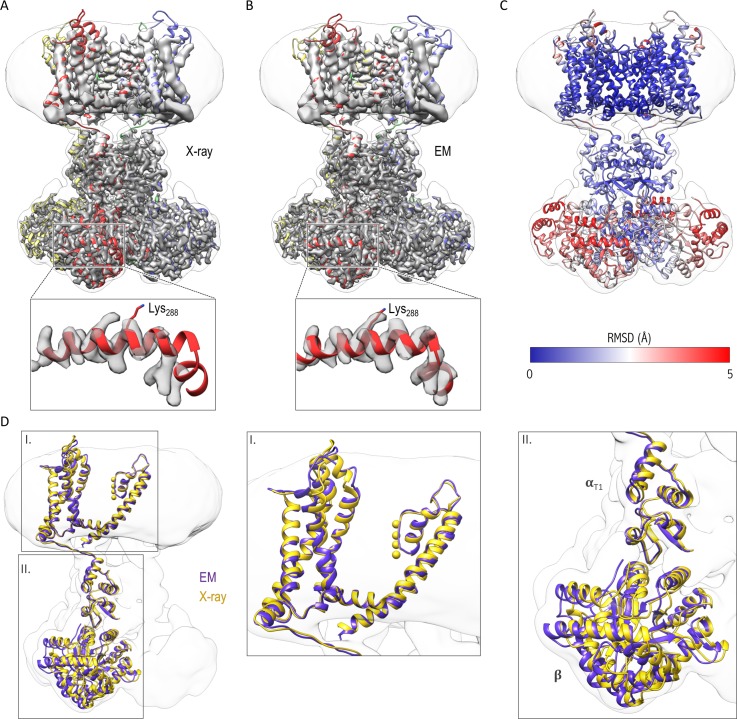
Figure 3.

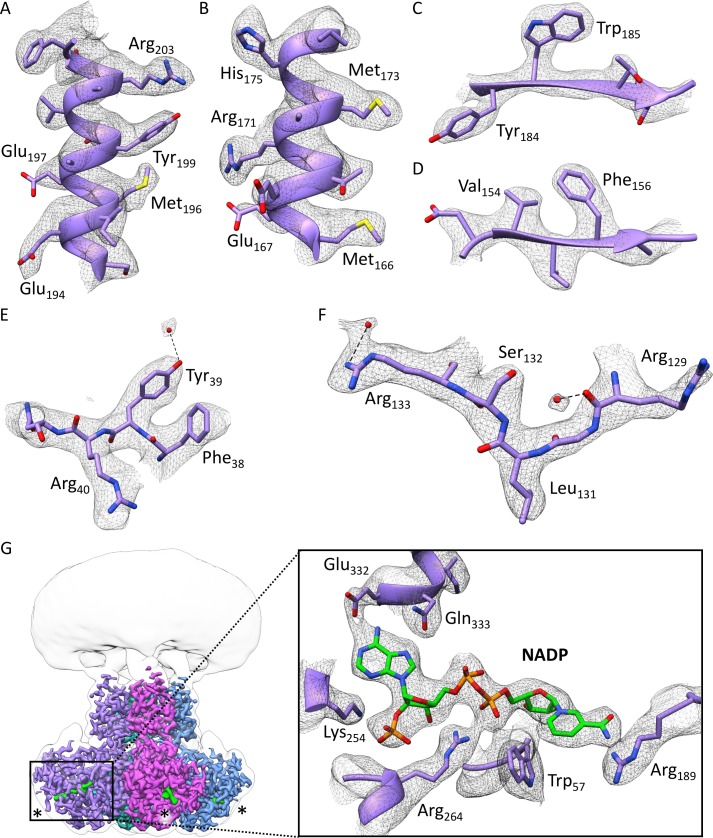
Figure 3—figure supplement 1. Quality of the cryo-EM density of the overall 3.0 Å resolution map of the cytosolic domain of the Kv chimera.

Figure 3—figure supplement 1.

(A–B) Examples of two α-helical regions. (C–D) Examples of two β-sheets. (E–F) Higher resolution regions revealing densities for bound water molecules. (G) Ligand NADP+ in β subunit with its coordinating residues. Glu329, Ser325 and Asp85 were removed for clarity.
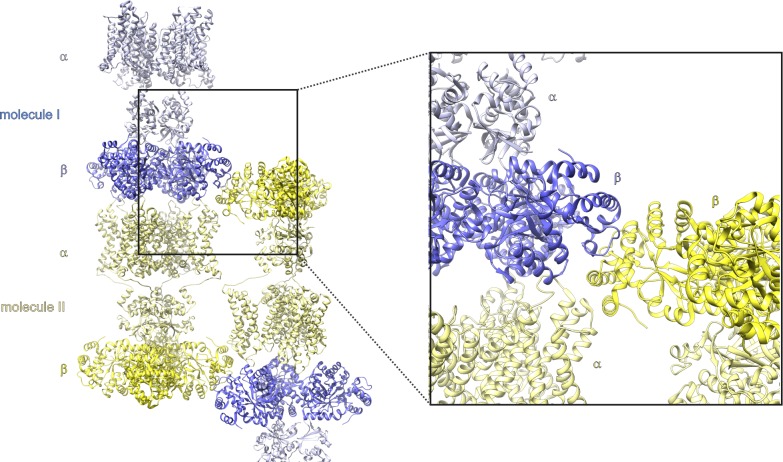
Figure 3—figure supplement 2. Crystal contacts between the Kv chimera β subunits in crystals used to solve the X-ray structure.

Figure 3—figure supplement 2.

PDB entry 2r9r. The asymmetric unit contains two molecules (one of four αβ monomers in molecule I and II) and each molecule is composed of channel-forming α subunits and auxiliary cytosolic β subunits. Highlighted are the contact sites of β subunits from independent molecules in the crystal.
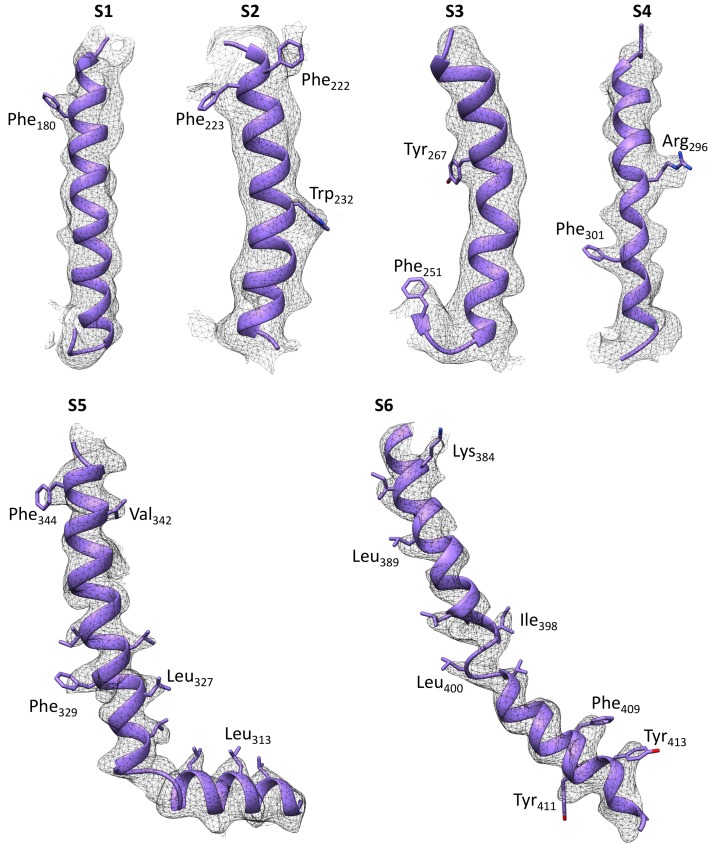
Figure 3—figure supplement 3. Quality of the cryo-EM density map of the transmembrane domain at an overall 4 Å resolution.

Figure 3—figure supplement 3.

The map was filtered according to local resolution. Six transmembrane helices S1 to S6 are shown. Several areas with large side chains show bumps along the sausage-like densities for the transmembrane helices. The resolution for S5-S6 in the center of the TM domain shows higher resolution compared to the peripheral S1-S4 helices within the voltage-sensing domain.