
Fig. 4. Letm1 function in adipogenesis and sensitivity to insulin concentration.
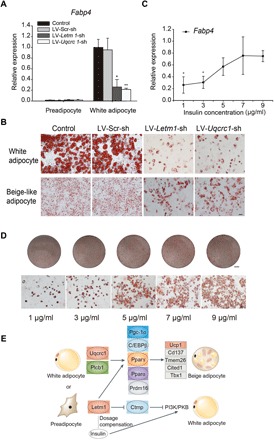
(A) Fabp4 expression in 3T3-L1 preadipocytes and differentiated white adipocytes. (B) Oil Red O staining of differentiated white adipocyte cultures and beige-like adipocyte cultures. (C) Fabp4 expression in differentiated white adipocytes from Letm1-depleted preadipocytes treated with increasing insulin concentrations. (D) Oil Red O staining of differentiated white adipocytes treated with increasing insulin concentrations. Scale bars, 5 mm (for the round dishes) and 50 μm (for microscopic Oil Red O staining). (E) Proposed regulatory pathways of Uqcrc1 and Letm1 in the development of beige adipocytes and Letm1 function in adipogenesis. n = 3 for all groups. Data are means ± SD for all bar graphs. *P < 0.05; **P < 0.01. Significant analysis was performed by one-sided Student’s t test.