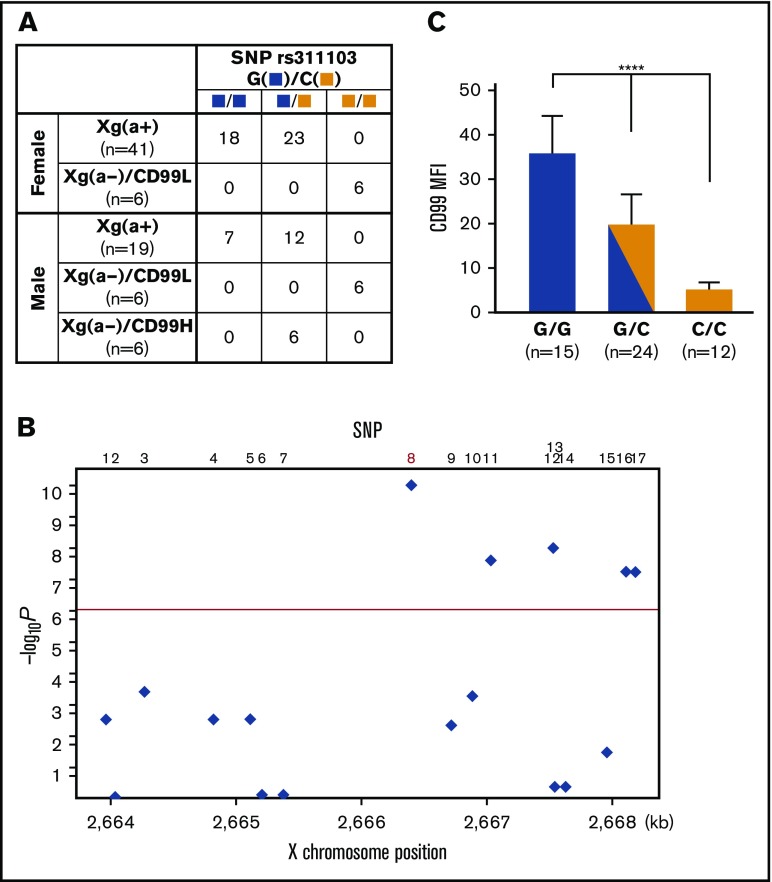
Figure 3.
Association between SNP rs311103 and Xga/CD99 blood groups. (A) Association of SNP rs311103 with the Xga/CD99 blood groups. The G and C polymorphic nucleotides of SNP rs311103 are identified by blue and yellow squares, respectively. In total, 16 of the 41 Xg(a+) female samples and 17 of the 19 Xg(a+) male samples were subjected to CD99 blood group typing, and the 33 Xg(a+) samples were found to have the CD99H phenotype. (B) Association P values of the 17 SNPs. The χ2 test was used to analyze the association P values of the 17 SNPs from the enrolled 78 individuals. The y-axis shows −log10 P values, and the x-axis shows the X-chromosome positions. The red horizontal line corresponds to a P value of 5.0 × 10‒7. SNP no. 8 is rs311103. (C) Quantitative comparison of RBC CD99 antigen expression levels across the individual groups with different genotypes at SNP rs311103. A total of 51 of the 78 individuals enrolled in the present study were subjected to quantitative analysis to determine their RBC CD99 antigen expression levels using flow cytometry. The means of the CD99 mean fluorescence intensities (MFIs; refer to the legend of Figure 1C) in each of the individual groups according to their genotypes at rs311103 are presented; the error bars indicate the standard error of the mean of each group. Statistical analyses among the different groups were performed using the Kruskal-Wallis test (****P < .0001).

