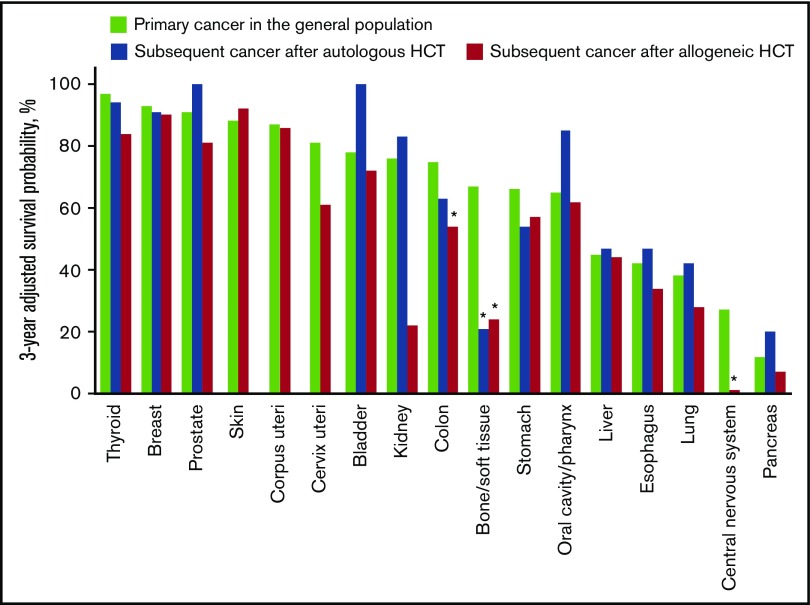
Figure 5.
Age-, sex-, and year of diagnosis–adjusted overall survival probability at 3 years after diagnosis of subsequent solid cancer in the HCT population and primary cancer in the general population. Cancers in the skin, uterus, and central nervous system after autologous HCT are excluded because of the small number of patients. *P < .05.

