Figure 6.
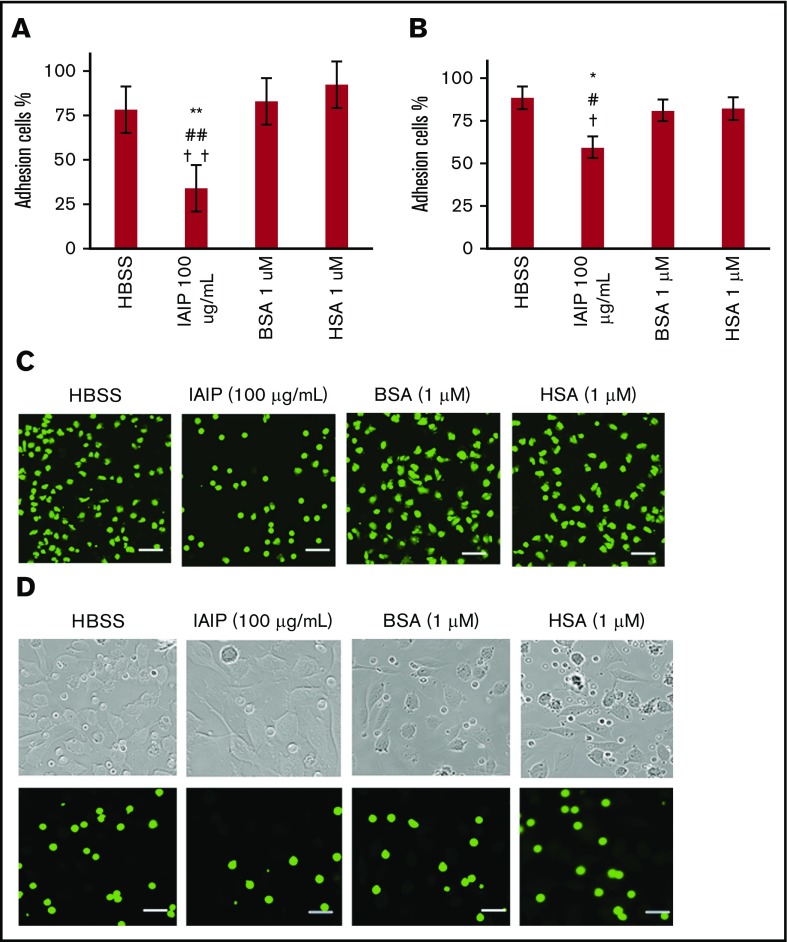
Neutrophil adhesion assay. The purified human neutrophils were incubated with HBSS, IAIPs (100 μg/mL), BSA (1 μM), or HSA (1 μM) for 1 hour at 37°C in a 96-well polystyrene microtiter plate (A,C) or on a monolayer of EA.hy 926 (B,D). After gentle washing of the microtiter plate or EA.hy 926 monolayer with PBS twice, the residual cell numbers were counted and expressed as percentages of the initial cell numbers. (A-B) The results shown are the means ± SEM of 10 experiments. **P < .01 vs HBSS, ## P < .01 vs HSA, and ††P < .001 vs BSA on a 96-well microtiter plate (A) and *P < .05 vs HBSS, #P < .05 vs HSA, and †P < .05 vs BSA on a monolayer of EA.hy 926 (B). (C-D) Typical pictures are shown from each group (calcein stain; scale bars, 20 μm). Top panels in panel D show the phase contrast images of corresponding lower fluorescence microscopic pictures.

