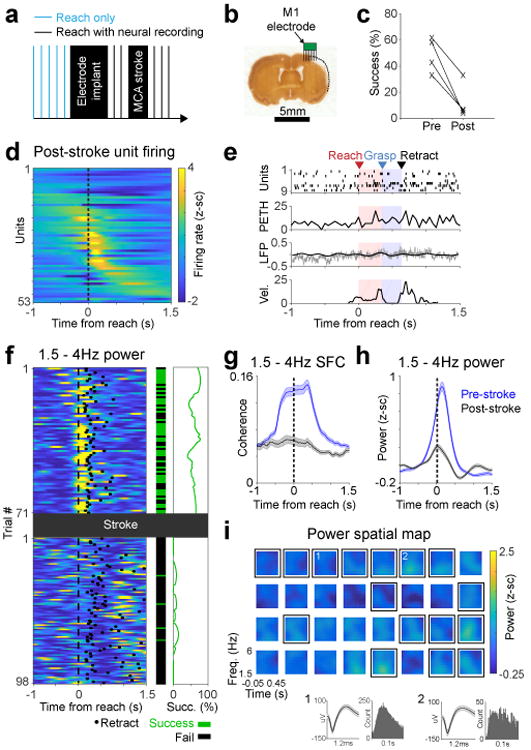
Figure 2. Stroke diminished LFO activity in M1.

a. Experimental paradigm. After the MCA stroke, we continued recording neural activity from M1 during the reach task in same animals as Fig. 1. b. Histological section showing stroke and approximate location of electrodes from one animal. We performed a similar histological analysis in 4 animals to verify that there was some observable lesion resulting from the stroke. c. Pellet retrieval success rate before (mean 48.9%, SD 13.4%) and after (mean 12.4%, SD 13.8%) distal MCA stroke in 4 rats (2-sided paired t-test, t(3) = 5.77, *p = 0.010). d. Z-scored unit firing rate changes relative to reach onset (53 units from 4 rats). e. Single trial example of diminished LFO activity. Labeling convention is the same as Fig 1d. Bottom panel shows paw velocity in arbitrary units. This is representative of trials that show low SFC and LFP power, quantified in subsequent panels (g/h) f. Trial-by-trial low frequency LFP power decrease after stroke shown in an example channel, paralleled by decrease in success rate. Left: 1.5-4 Hz LFP power, middle: trial by trial success rate, right: success rate smoothed over 25 trials. Only trials in which rat reached and touched the pellet were included. This is representative of a channel that shows high power prior to stroke and low power after, as quantified in subsequent panels (g/h) g. Quantification of 1.5-4 Hz SFC before (n = 171 units) and after (n = 53 units) stroke in 4 rats. Thick lines show mean and shaded area is SEM. h. Quantification of changes in low frequency LFP power after stroke, comparing all paired channels (n = 101) from all 4 animals. Shaded area is SEM. i. Example grid of channels from the same rat as in Fig 1 and in the same scale. Channels with spiking activity are enclosed by black squares. Insets 1 and 2 show mean unit waveforms (shaded area is SEM) and inter-spike interval histograms from 2 selected channels. All 4 animals demonstrated a similar loss of low frequency power across channels after the stroke.
