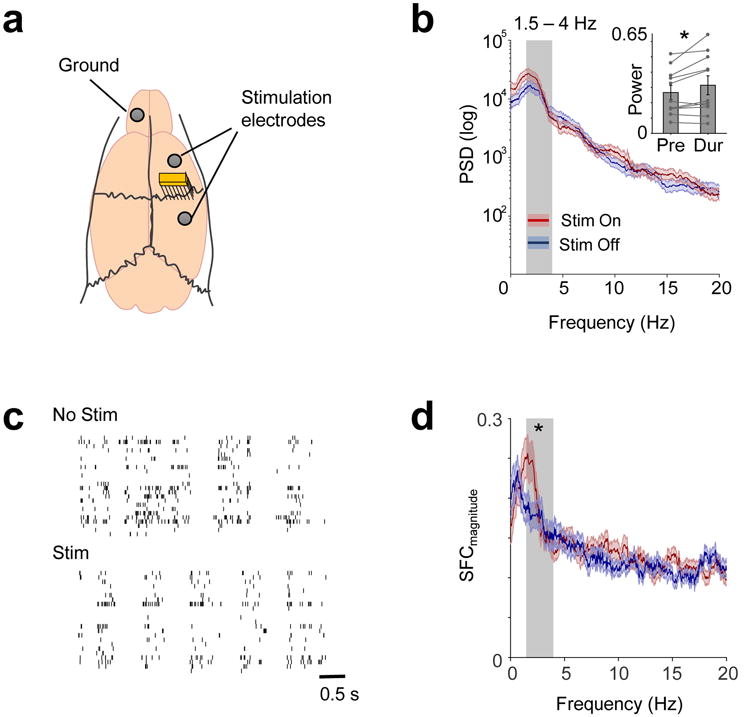
Figure 5. LFO activity increased with Direct Current Stimulation (DCS) in acute (anesthetized) recording sessions.

a. Recording and stimulation arrangement in acute experiments. b. LFP power before and during DCS shown in one session. Grey shaded area shows 1.5-4Hz frequency range. Thick lines in blue and red show mean and shaded areas show SEM. Inset shows 1.5-4Hz power in pre-DCS and during-DCS in all 11 sessions from 10 rats (mean and SEM shown in bar plots with individual values, two-tailed paired t-test, t(10) = -2.493, *p = 0.032). c. Spiking activity of the same neurons from a session before and during stimulation, showing increased coherent spiking during DCS. d. Mean SFC (dark red/blue line - conventions as previous) of 50 neurons from 10 rats. Shaded area represents SEM. 1.5-4Hz SFC (grey shaded area) increased with DCS (one-tailed paired t-test, t(49) = -1.727, *p = 0.045).
