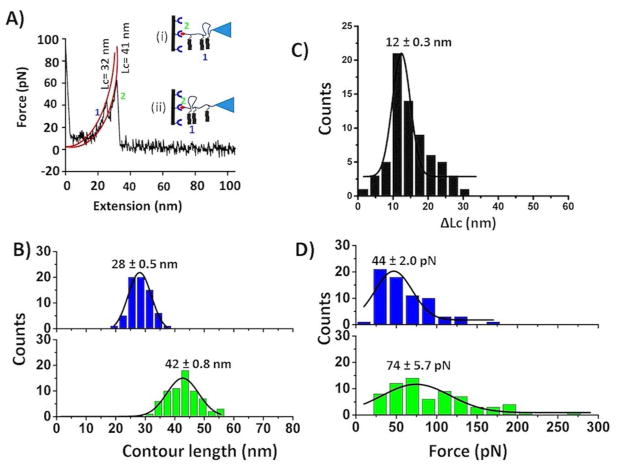
Figure 3.
Identification of Aβ (14–23) dimers within trimer. (A) A typical force-distance curve showing two peaks close to each other; possible interaction patterns are shown in the inset. Individual peaks were fitted with the worm-like chain model36 (red line), and corresponding Lc values are shown. (B) Contour length histograms for two separate events. (C) ΔLc histogram related to two events. (D) Force histograms corresponding to peptide-peptide (upper, blue) and biotin-streptavidin interactions (below, green). Histograms were fitted with Gaussian functions, and values are shown as mean ± S.E.M. The number of data points is 68.

