Figure 4.
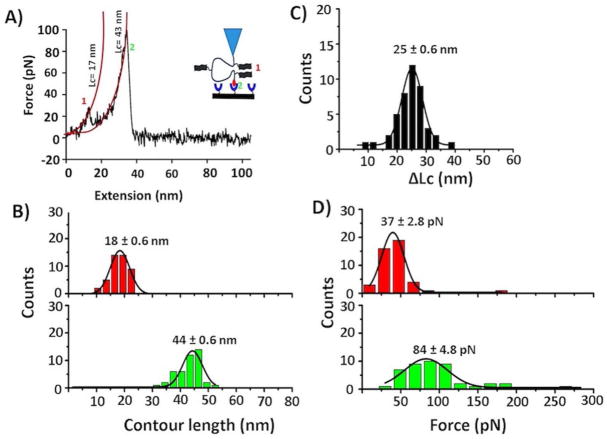
Characterization of Aβ (14–23) dimers. (A) A typical force-distance curve showing two peaks far from each other; Lc values for each individual peaks were estimated by the worm-like chain model (red lines). (B) Contour length histograms for two different events; red = Aβ (14–23) dimer and green = Biotin-streptavidin interaction. (C) ΔLc distribution corresponding to a long distance between two peaks. (D) Force histograms corresponding to peptide-peptide (upper, red) and biotin-streptavidin interactions (below, green). Histograms are fitted with Gaussian function, and values are presented as mean ± S.E.M. The number of data points is 44.

