
Figure 3.
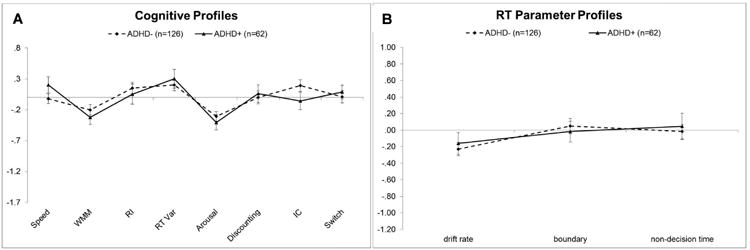
A) Cognitive and B) Reaction time parameters in the ADHD+ASD and ADHD-ASD groups. Z-scores are plotted so that all variables are represented on the same scale. More negative scores indicate worse performance on cognitive profile measures and factors contributing to slower performance for RTs (i.e., less efficient information processing, wider boundary separation, and slower non-decision times). The scales are intentionally kept the same as in Figures 1 and 2 to facilitate visualization of group differences.