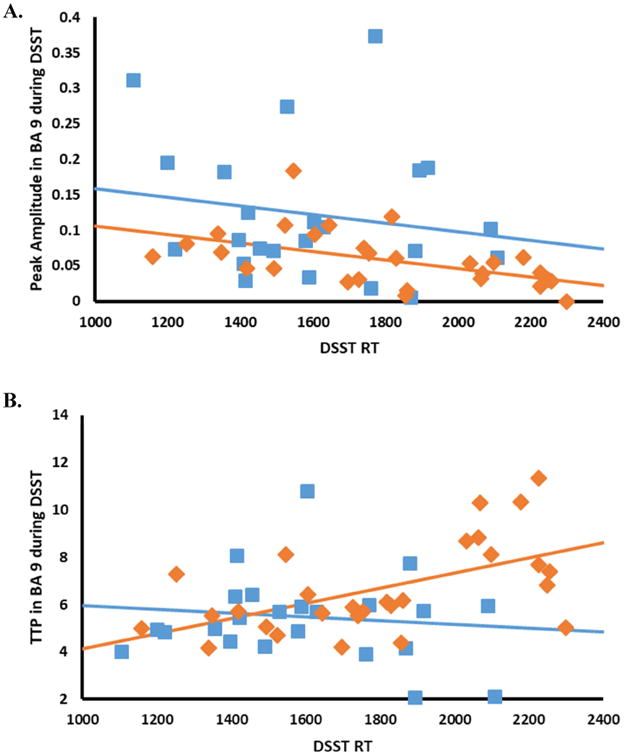
Figure 4.

Relationships between performance (as measured by RT on the DSST) and (A) peak amplitude and (B) TTP in bilateral BA 9. Lines represent the best fit to the data using least-squares linear regression. Healthy controls are in blue, and MS patients are in orange.
