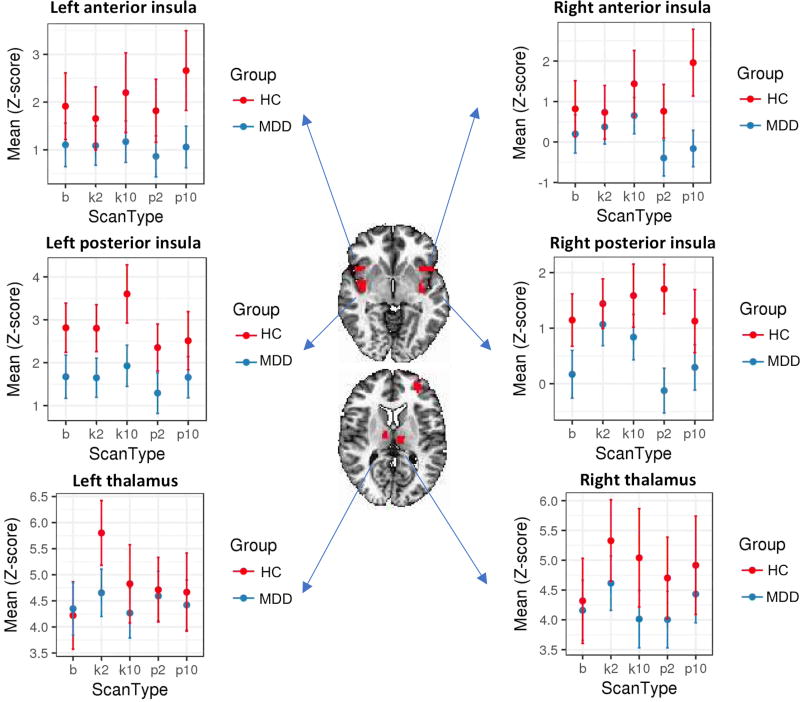
Figure 5.
Mean connectivity for regions of interest (ROIs) with significant differences across scans for both healthy control (HC; red) and major depressive disorder (MDD; blue) groups for the bilateral anterior (first row), posterior insula (second row), and thalamus (third row). Error bars represent standard deviation.

