
Figure 2. mTOR-pathway hyperactivation in TSC2-deficient hiPSC-derived NPCs.
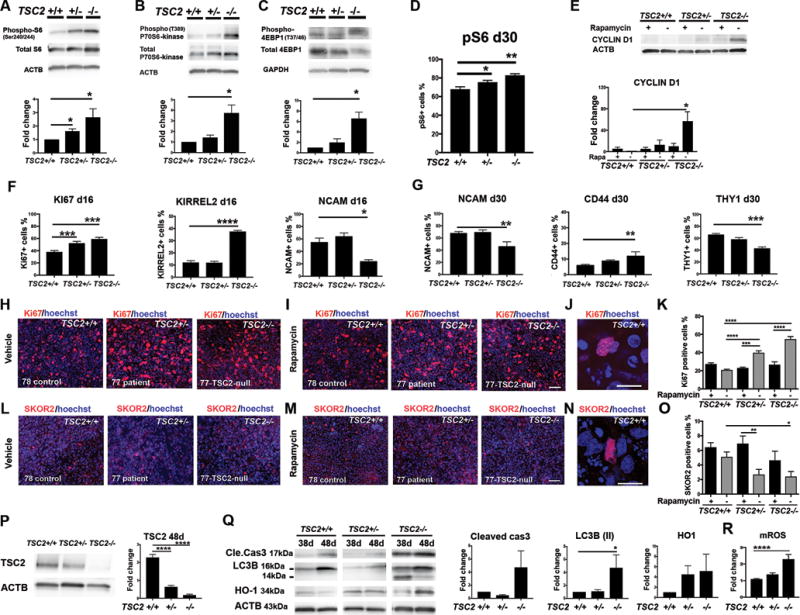
Protein expression analyses of the hiPSC-NPCs from the cell lines 78-control (TSC2+/+), 77-patient (TSC2+/−) and 77-TSC2-null (TSC2−/−). A–C) Semi-quantitative analyses of pS6/S6, p-P70S6-kinase/P70S6-kinase, and p4EBP1/4EBP1 intensities between control hiPSC-NPCs (fold change=1) and TSC-deficient NPCs. Fold changes were analyzed with one-way ANOVA and post-hoc-test between columns (*p<0.05). D) Flow cytometric analyses of pS6+ cell number at day 30, one-way ANOVA and post-hoc-test between columns (*p<0.05, **p<0.01). E) WB analyses of the CYCLIN D1 at day 24. F) Flow cytometric analyses of Ki67, KIRREL2, NCAM at day16, and G) NCAM, CD44, and THY1 at day 30 of differentiation. All data are presented as mean±SEM. One-way ANOVA, post-hoc test between groups, (****p<0.0001, ***p<0.001, **p<0.01, *p<0.05). H–I) Representative images of Ki67+ cells at day 24 of differentiation, scale bar 32 μm. J) Higher magnification of a Ki67+ cell, scale bar 10 μm. K) Quantification of Ki67+ cells. L–M) Representative images of SKOR2+ cells at day 24 of differentiation, scale bar 32 μm. N) Higher magnification of a SKOR2+ cell, scale bar 10 μm. O) Quantification of SKOR2+ cells. Nuclear staining (Hoechst, blue). Two-way ANOVA, followed by post-hoc-test for Ki67 (in K) and SKOR2 (in O) analyses. (****p<0.0001, ***p<0.001, **p<0.01, *p<0.05). Data are presented as mean±SEM. (K and O data are from cell lines; 78 control (TSC2+/+) 77 patient (TSC2+/−) and 77-TSC2-null (TSC2−/−). P) WB analyses of TSC2 expression between control (fold change=1) and TSC-deficient cerebellar cells (n=3) at day 48 of the neural differentiation of hiPSCs. Fold changes were analyzed with one-way ANOVA and post-hoc test, ****p<0.0001. Representative blots of 78 control (TSC2+/+), 77 patient (TSC2+/−) and 77-TSC2-null (TSC2−/−) cell lines are presented (P–Q). Q) Increased expression of apoptosis marker cleaved caspase 3, autophagy activation marker LC3B (II, size 14kDa) were detected in TSC2−/− cell population at day 48. Variable expression of oxidative stress marker HO-1 were detected in both TSC2+/− and TSC2−/− cells compared to control cell population (TSC2+/+). LC3B (II)/ACTB expression was significantly up-regulated in TSC2−/− cells at day 48, (one-way ANOVA, post-hoc-test, *p<0.05). R) Flow cytometric analyses of mROS in hiPSC-PCs (one-way ANOVA, post-hoc-test, ****p<0.01).