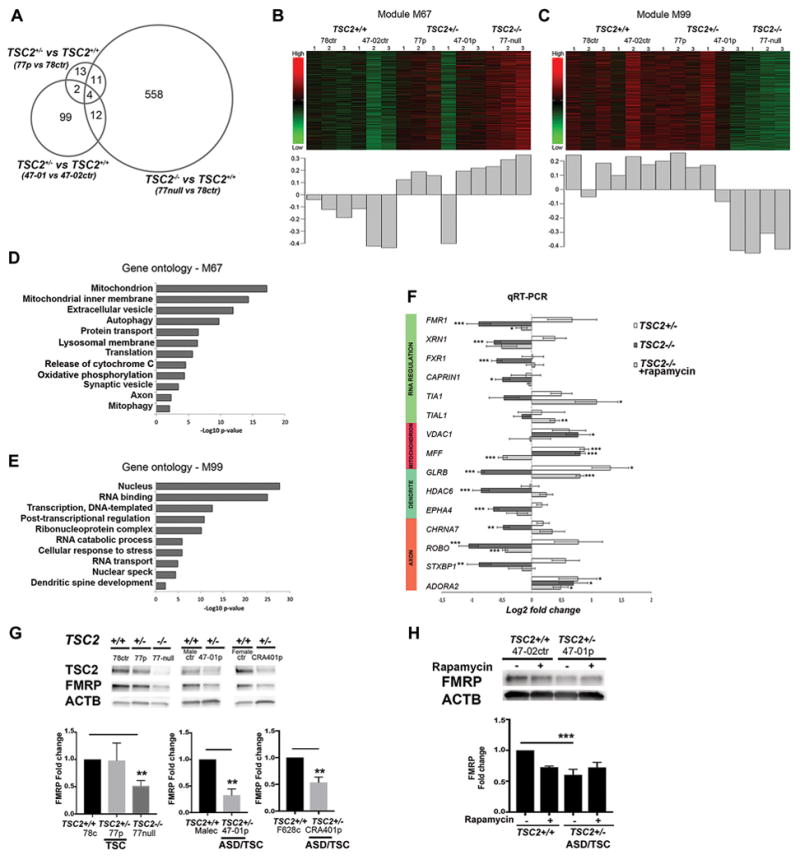
Figure 5. Gene expression profiling of TSC2 deficient hiPSC-derived PCs.

RNA sequencing analysis of hiPSC-PCs from controls (TSC2+/+) (47-02, 78), patients (TSC2+/−) (47-01 and 77) and TSC2-null cell line (TSC2−/−). A. Venn diagram demonstrating the number of differentially expressed genes for each comparison (FDR < 0.01), and their relationship to each other. B–C). Heatmaps and first principal components of the co-expressed groups of transcripts with the strongest positive (M67) and negative correlation with genotype (M99). The heatmap depicts scaled expression of all transcripts within the co-expression group, where green is low relative expression and red is high relative expression. The bar graph shows the first principal component of the expression of the transcripts within the co-expression module. D–E) Gene ontology analysis for genes belonging to the co-expression modules with strongest positive and negative correlation with genotype. Gene ontology terms were selected for specificity and non-redundancy. The x-axis represents –log10 p-value for enrichment of the GO term calculated by DAVID. F) qRT-PCR analyses from pooled data of two patients (47-01 and 77), two controls (47-02 and 78) and three replicates of TSC2-null lines, and rapamycin treated TSC2-null cells. G) FMRP expression in THY1+ hiPSC-PCs from three individual control lines (78 control, and sex-matched male-control and female-control line), vs three patient lines (77 patient, 47-01 patient, CRA401patient) and TSC2-null cell line (n=3). ASD/TSC2-patient derived PCs (47-01 and CRA401) and TSC2-null cells had significantly reduced FMRP expression compared to control cells. One-way ANOVA followed by post-hoc analyses and t-test between two groups, **p<0.01. H) FMRP expression in vehicle or rapamycin treated hiPSC-derived PCs at day 48 of differentiation. Fold changes were analyzed with two-way ANOVA followed by post-hoc-test, (***p<0.001).
