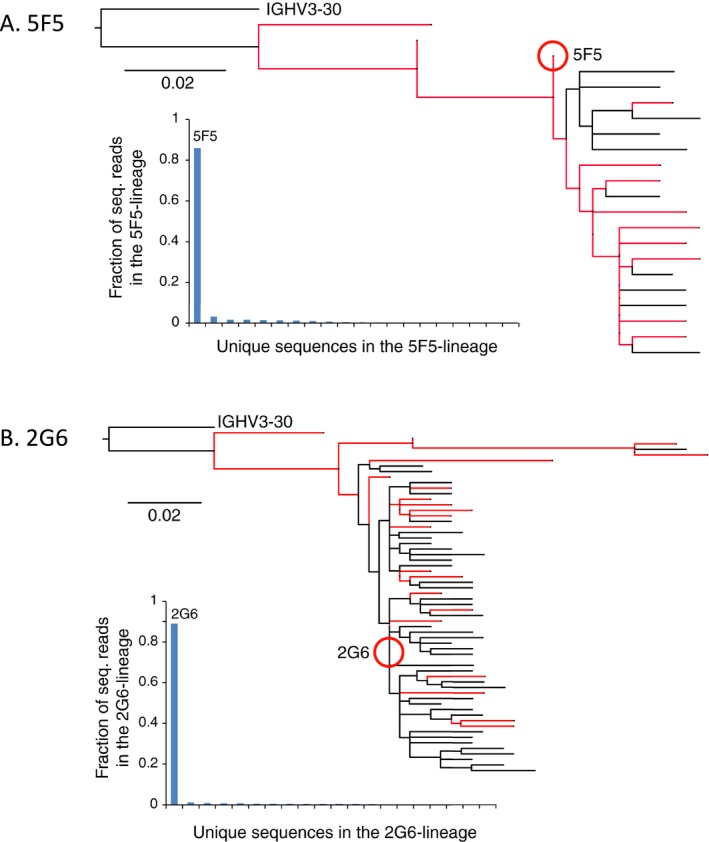
Figure 7.

Phylogenetic analyses of the 5F5 and 2G6 mAb lineages. The patient's peripheral blood B‐cell population was sampled, after in vitro proliferation and prior to cell fusion, and analyzed by Ig heavy chain sequencing. Lineages were defined to include sequences with >80% nucleotide sequence homology in CDRH3 domain, and were analyzed by Clustal sequence analysis. Sequences with identical CDRH3 domains are shown in red. Below each dendrogram is plotted the fraction of total sequencing reads for each lineage member. (A) 5F5. (B) 2G6.
