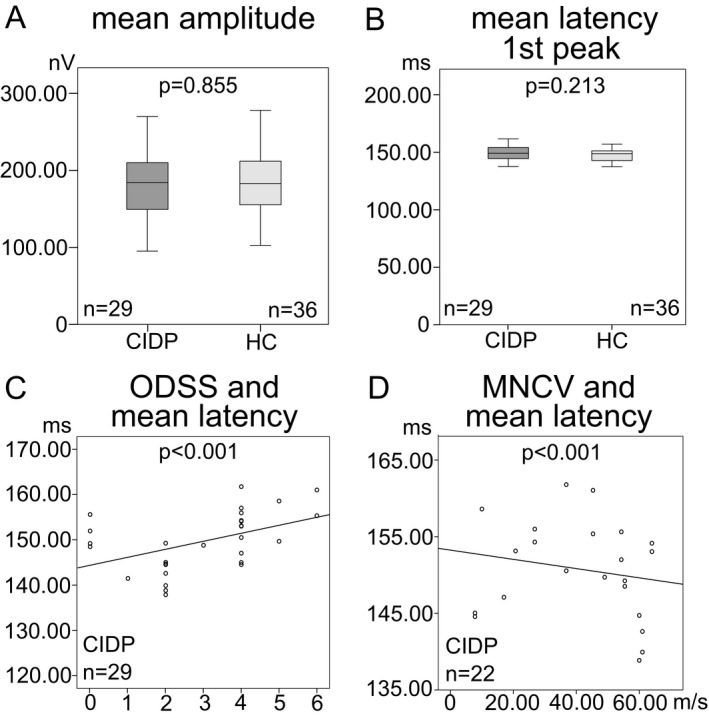
Figure 2.

mfVEP parameters of CIDP patients and healthy controls (HC). Box‐and‐whisker plots of the mean amplitude in nV (A) and the mean latency of the first peak in msec (B). The black line within the box indicates the mean, the box marks the interquartile range and the whiskers represent the minimum and maximum. Scatter plots of the association between the ODSS (overall disability sum score) and the mean latency (C), and the MNCV (motor nerve conduction velocity) of the right ulnar nerve in m/sec and the mean latency (D). Each eye is shown as a dot. Regression lines, numbers of eyes, and P ‐values (GEE analysis) are provided for the different mfVEP parameters.
