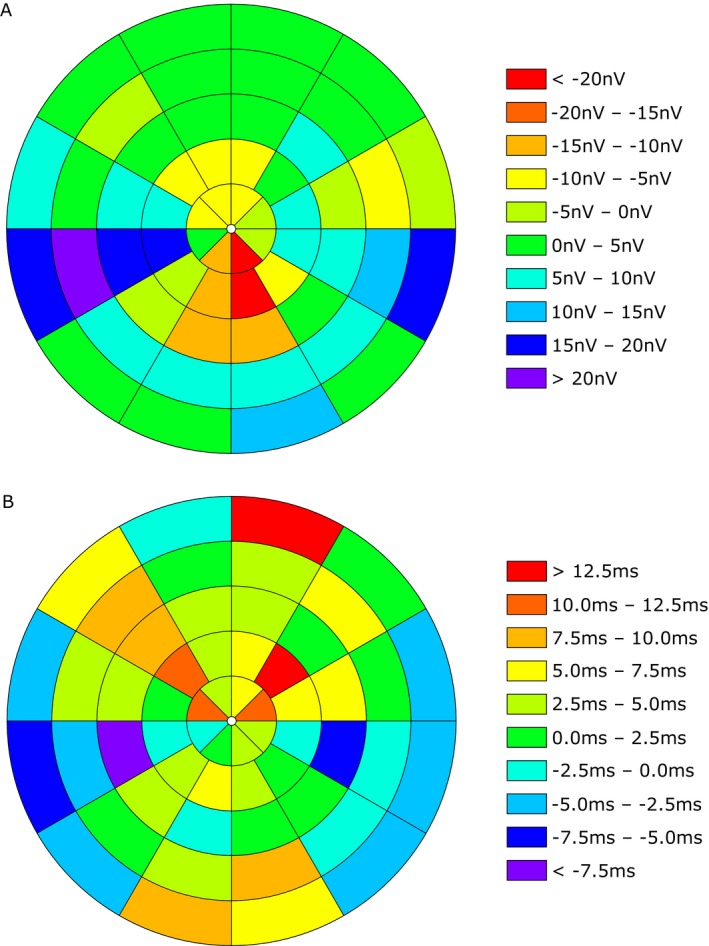
Figure 3.

Differences in each segment of the visual field between CIDP patients and healthy controls (HC). Heat maps show the amplitude in nV (A) and the latency in msec (B). Different colors represent the positive or negative value of the differences (CIDP – HC).
