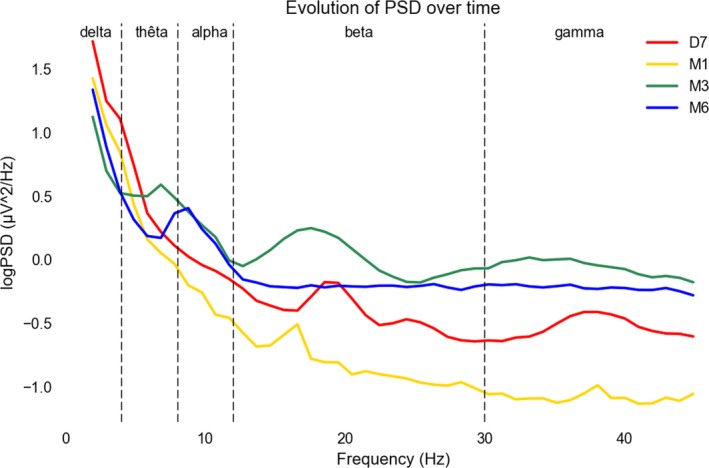
Figure 1.

EEG power spectral density evolution. Legend. Evolution of the power spectral density of the EEG (log transform, unit log(μV2/Hz)) overt time showed the predominance of slow rhythm mainly in the delta (1–3‐Hz) frequency band at D7 and until M1. At M3, the background rhythm enriched with the diminution of the slow frequency for the benefit of theta (4–8 Hz) frequencies. At M6, theta frequencies left room to a normal alpha (9–12 Hz) background rhythm. Together with this rapid beta and gamma rhythm power spectra also increased over time probably due to more muscle artifacts with the patient regaining some mobility. See Data S1. D7, Day 7; Hz: Hertz; M1, Month 1; M3, Month 3; M6, Month 6; PSD, Power Spectral Density: V, Volt.
