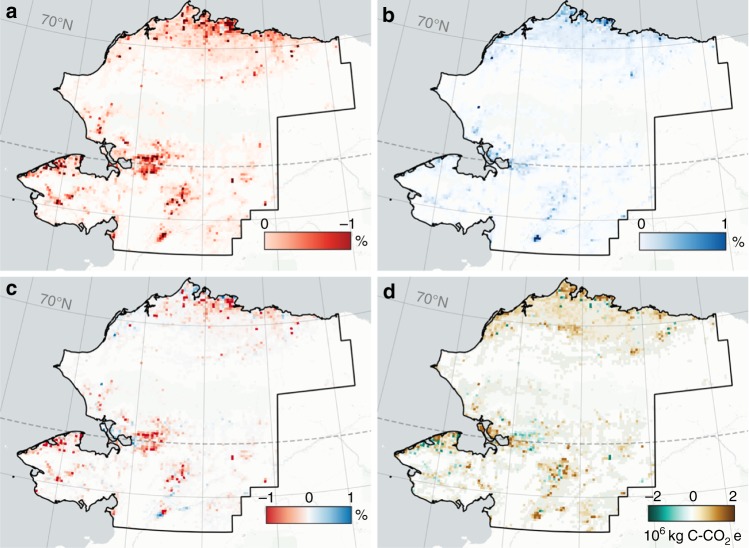
Fig. 3.
Lake area change and carbon flux implications in the permafrost region of northwestern Alaska for 1999–2014 determined with Landsat satellite trend analysis. Gross lake area loss (a), gross lake area gain (b), net lake area change (c), and net change in carbon flux associated with expansion and drainage (d) have been aggregated in 7.5 km × 7.5 km grid cells (5625 ha per cell). Background map: CartoDB Positron layer accessed with QuickMapServices QGIS Plugin. Panels a–c show the absolute percent water fraction change per grid cell. In d, net change in carbon flux over the 15-year observation period. Despite a net lake area loss for the region, large permafrost-soil derived carbon emissions associated with gross lake area gain overwhelm smaller flux changes associated with gross lake area loss, leading to a net increase in regional carbon emissions (Supplementary Table 3)

