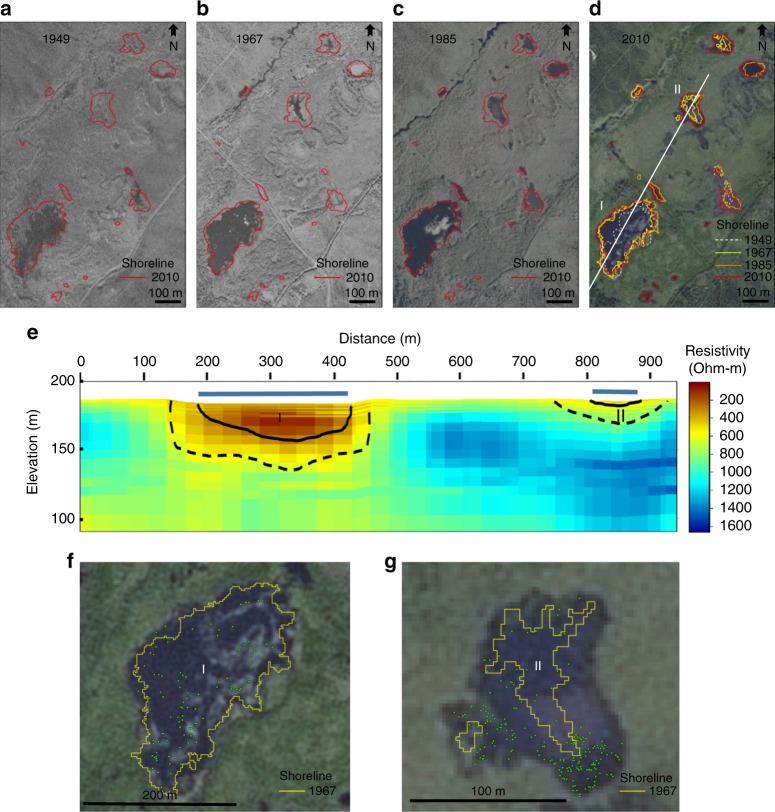
Fig. 5.
Interior Alaska abrupt permafrost thaw. Time series (1949–2010) showing thermokarst-lake development based on historical aerial photograph (a–c) and 2.5-m SPOT (d) shoreline analysis. Dashed lines in d delineate dark areas in 1949 images interpreted as shallow, vegetated wetlands that later developed into open-water lakes. In e, thaw depth (solid line) and degraded permafrost (dashed line), interpreted from helicopter-borne electromagnetic data-derived 3D resistivity model (Supplementary Methods); extracted cross section is the white line in d. Field work shows strong, 14C-depleted methane ebullition seeps [green dots in (f) Lake I, Oct. 2014 and (g) Lake II, Oct. 2016)] overlapping recent abrupt permafrost thaw areas (e.g., thaw since 1949–1967). Strong seeps are absent in lakes lacking recent abrupt thaw (Supplementary Fig. 8, Supplementary Discussion)

