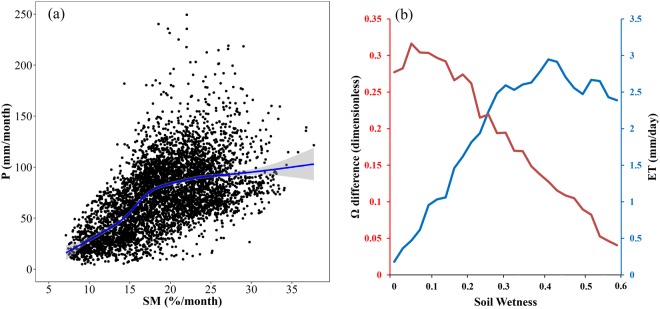
Figure 6.
Relationships of soil moisture with precipitation (a) and evapotranspiration (b). (a) presents scatterplots of mean monthly precipitation against soil moisture for all points over the study area, and the blue line is the fitted trend based on auto smoothing method, with shaded area denoting 95% confidence interval. (b) presents the variations of evapotranspiration and Ω difference (the fraction of variance in ET explained by soil moisture variations) with the increase of soil wetness (adjusted From Koster, R. D. et al. Regions of strong coupling between soil moisture and precipitation. Science 305, 1138–1140 (2004). Reprinted with permission from AAAS). (Generated by free software R, https://www.R-project.org/).

