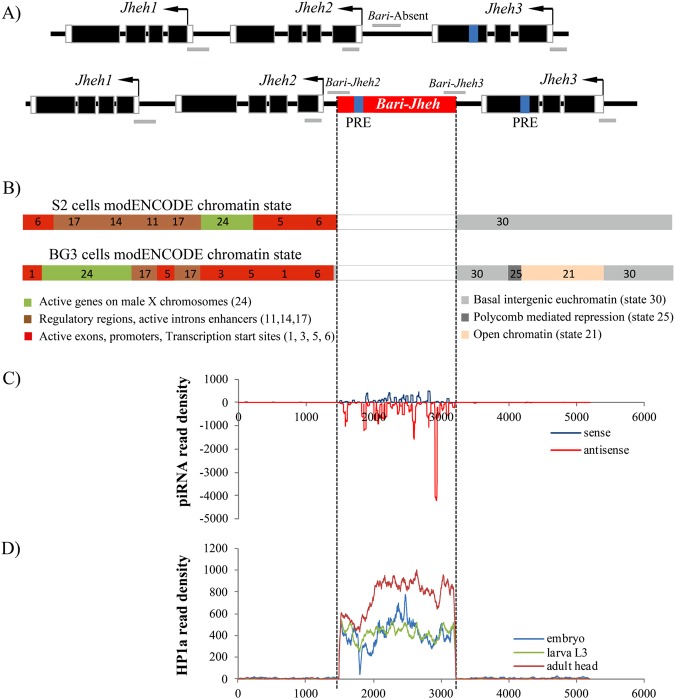
Figure 1.
Bari-Jheh could be adding heterochromatin marks to the Jheh intergenic region. (A) Schematic representation of Jheh genes in flies without Bari-Jheh and flies with Bari-Jheh. Black boxes represent exons, black arrows represent the direction of transcription, white boxes the 5′-UTR and 3′-UTR regions, the black line indicates intergenic or intronic regions and the red box represents Bari-Jheh. Grey lines represent the amplicons of the five regions analyzed using ChIP-qPCR experiments. The blue bars indicate the approximated position of the predicted PREs. (B) modENCODE chromatin states in S2 cells and BG3 cells in the region analyzed. S2 cells and BG3 cells are derived from late male embryonic tissues and the central nervous system of male third instar larvae, respectively (The modENCODE consortium et al. 2010). Colors and numbers represent different chromatin states. The vertical discontinuous lines indicate the location of Bari-Jheh insertion, which was not analyzed by modENCODE. (C) Mapping of piRNA reads in the Bari-Jheh and flanking regions. Reads mapping in sense orientation are represented in blue, and reads mapping in antisense orientation in red. (D) Mapping of HP1a reads in the Bari-Jheh and flanking regions. Reads from embryo stage are represented in blue, reads from larva L3 stage in green, and reads from adult head in red.

