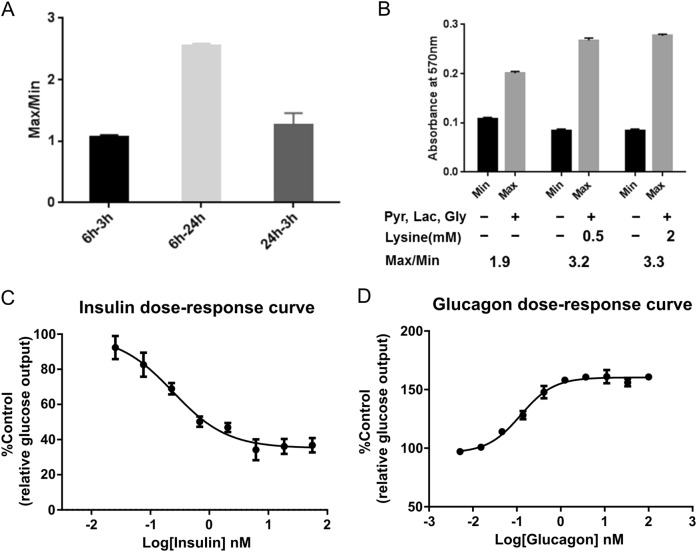
Fig. 1.
Optimize glucose production assay for primary human hepatocytes. a Ratio of MAX and MIN raw signal at indicated time points. Min: basal glucose signal without gluconeogenic substrates treatment; Max: glucose signal with gluconeogenic substrates treatment. 6–3 h/6–24 h: starve cells for 6 h and treat cells with gluconeogenic substrates for 3 or 24 h, respectively; 24–3h: starve cells for 24 h and treat cells with gluconeogenic substrates for 3 h. (n = 3). b Absorbance at 570 nm when treating human primary hepatocytes with pyruvate, lactate, glycine with or without lysine. (n = 3). c Dose response of gluconeogenesis inhibition by insulin. (n = 3). d Dose response of gluconeogenesis stimulation by glucagon. (n = 3)

