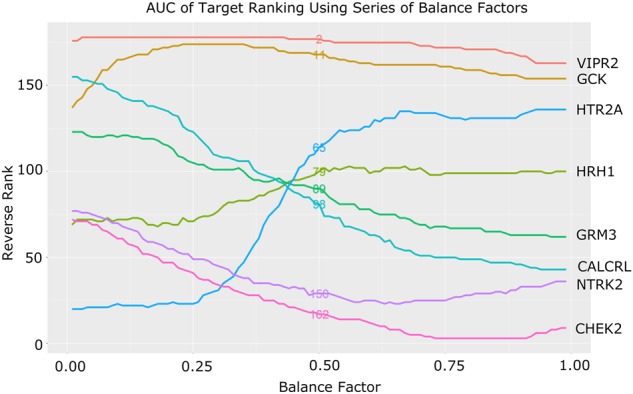
Fig. 4.

AUC of target ranking using series of balance factors. Representative targets were used to depict different scenarios resulting from balanced factors analysis. Each color line represents a target. Target names as well as their AUC rankings are shown in the figure. Neutral set of balance factor is b1 = 0.5 and b2 = 0.5, e.g., active and inactive assay both contributes half in the final ranking. Rankings of this balance factor are also displayed in the middle of each line. Overall, this neutral balance factor ranking correlates very well with the AUC ranking as we expected (Kendall’s rank correlation τ = 0.865)
