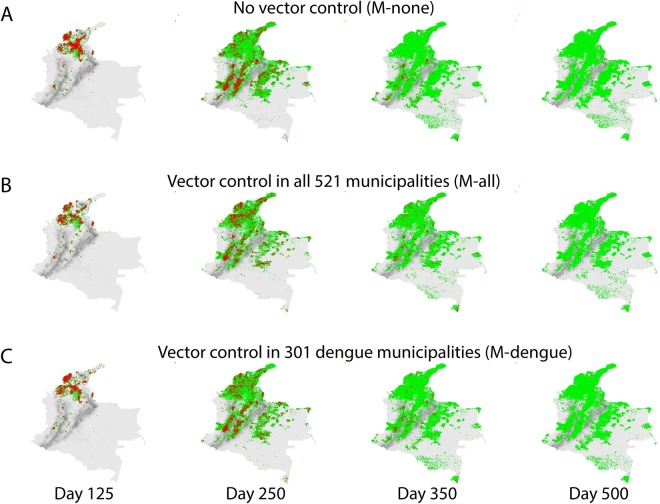
Figure 4.
Spatial progression of the CHIKV epidemic in Colombia with no vector control and with vector control in municipalities that previously reported DENV. Household locations of infected (red) and recovered (green) cases. Altitude per 1 × 1 km grid cells in grey. (A) Households of infected and recovered cases for the simulated scenario without vector control on days 125, 250, 350, and 500 of the epidemic; (B) as (A) for the scenario with vector control in all municipalities (M-all); and (C) as (A) for the scenario with vector control in 301 municipalities that had reported DENV in 2010 (M-dengue). Maps were created using R v.3.2.3 (https://www.r-project.org).

