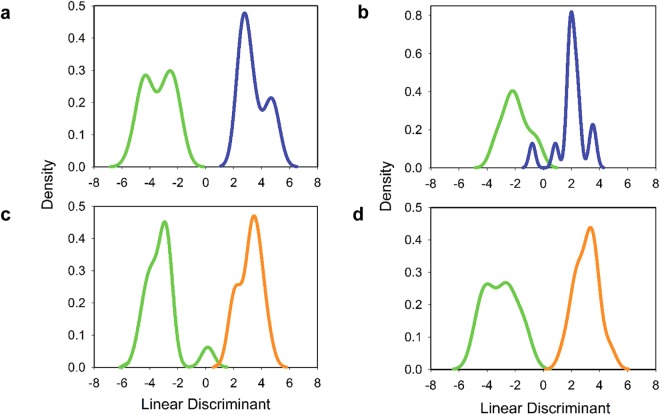
Figure 5.
LDA analysis of ELD versus HC and ELD versus MONO. LDA analysis of (a) ELD (green) versus HC (blue) using the 408 MF positive-ion mode metabolic biosignature, (b) ELD (green) versus HC (blue) using the 113 MF negative-ion mode metabolic biosignature, (c) ELD (green) versus MONO (orange) using the 633 MFs positive-ion mode metabolic biosignature, and (d) ELD (green) versus MONO (orange) using the 164 MF negative-ion mode metabolic biosignature.

