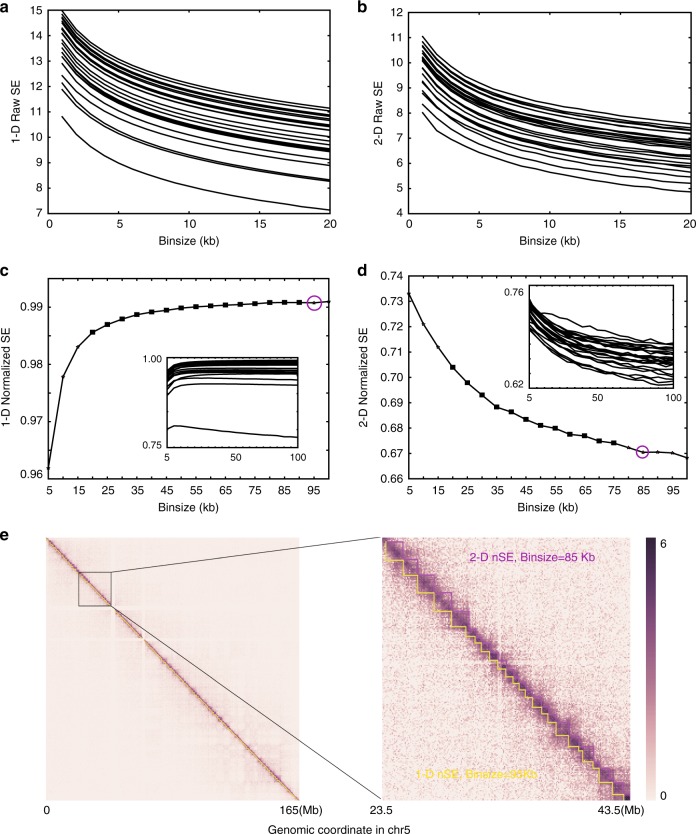
Fig. 4.
Using SE to determine the proper binsize for a given Hi-C dataset. Before normalization both a 1D-SE and b 2D-SE decrease in a near-monotonic manner with increasing binsizes in all 24 chromosomes. After normalization, both c 1D-SE and d 2D-SE differ far less with binsize for most of the binsize range. The main plots show data from chromosome 5, and the minimum stable binsizes are marked as magenta circles. The embedded plots show the curves for all 24 chromosomes. e Heatmap of the Hi-C data for chromosome 5 in hES cells taken from the data of Dixon et al.6 deDoc(M) predicted domains using binsizes of 85 and 95 kb are highlighted in magenta and yellow sawteeth, respectively. The two binsizes were determined by 1D-SE and 2D-SE, respectively, as the best resolution

