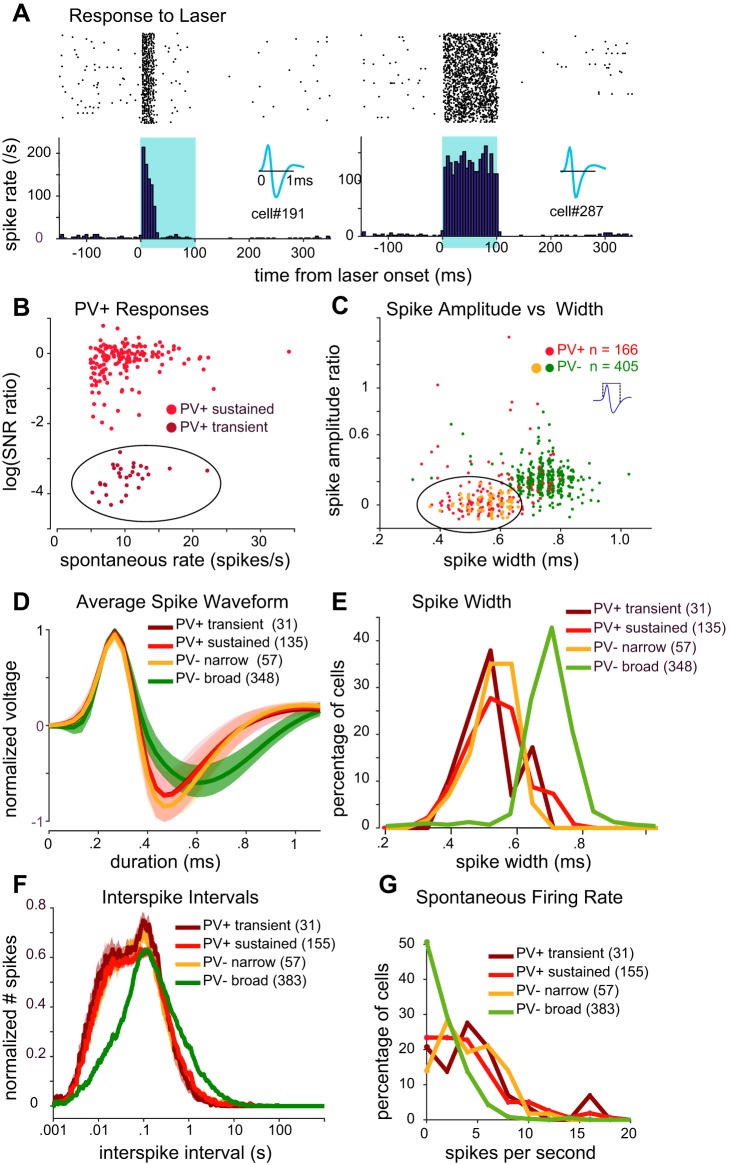
Fig. 1.
Identification of cell types. A: examples of transient (left) and sustained (right) parvalbumin-expressing (PV+) responses to laser. Raster plot (top) is summarized as a peristimulus time histogram (bottom). Illumination (100 ms) is indicated by blue shading. Insets show spike waveform of each cell. B: for each PV+ cell, the persistence of spiking throughout the duration of the laser pulse is plotted against the cell’s spontaneous spike rate. “Persistence” is quantified as the log [signal-to-noise-ratio (SNR) for the third 25-ms period after laser onset divided by SNR for the first 25 ms after laser onset]. We clustered PV+ cells into 2 subsets: transient (dark red circles within ellipse) and sustained (light red circles). C: spike peak-to-trough amplitude ratio plotted against peak-to-trough width. Inset shows how spike width was measured. A subset of narrow-spiking PV− cells (PV− narrow; orange circles within ellipse) that overlapped with the main cluster of PV+ cells was identified for further analysis. D: average spike waveform (solid lines indicate mean across cells, lighter shading denotes SE) for each of the identified cell types. Each cell’s average waveform was normalized before averaging across cells. E: distribution of spike widths for each cell type. In C–E, only cells with spikes recorded with a leading positive phase were included for analysis. F: average interspike interval histogram (solid lines indicate mean, lighter shading denotes SE) for each cell type. Histograms were normalized for each cell before averaging. G: histograms of spontaneous firing rate for each cell type. Number of cells (in parentheses in D–G) for each analysis varied slightly after screening for insufficient data.

