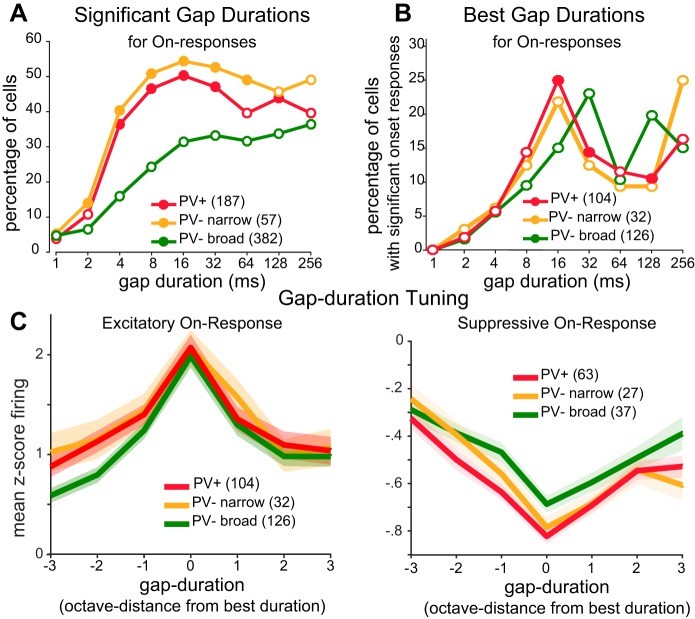
Fig. 3.
Tuning of on-responses to gap duration for each cell class. A: percentage of cells with significant on-responses to each gap duration (closed circles: P < 0.05 significantly different from PV− broad, χ2 test). B) Distribution of best gap durations for cells that had significant on-responses (filled circles: P < 0.10 significantly different from PV− broad, χ2 test). C: population-averaged gap duration tuning curves. Duration tuning curves for excitatory (left) or suppressive (right) responses were aligned to each cell’s best gap duration (solid lines indicate mean; shaded area denotes SE). Baseline firing rates correspond to z scores of zero. Gap durations are represented in octaves from best gap duration (i.e., in log2 units of the duration in ms).

