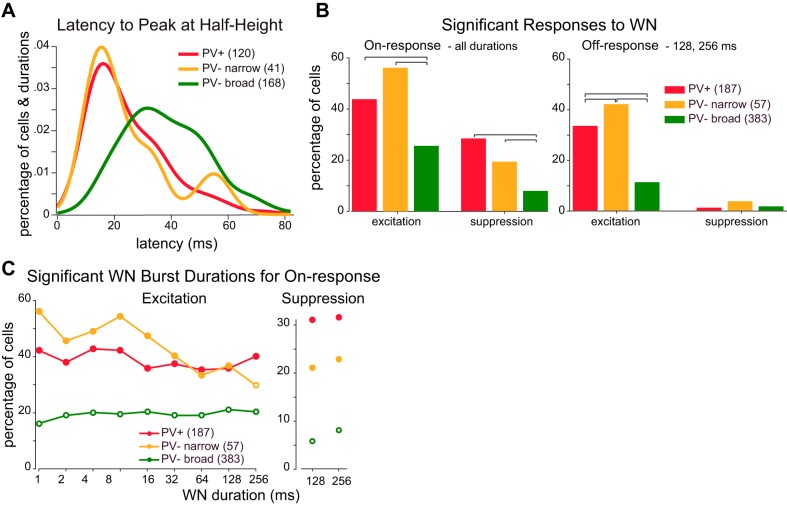
Fig. 4.
Responses to white noise (WN) bursts. A: latency from stimulus onset to the time when firing first reached half the height of the peristimulus time histogram peak. Latencies were compiled across cells and burst durations with significant responses. B: percentage of cells with significant on-responses (left) or off-responses (right) to WN bursts to any of the tested durations. Brackets above histograms indicate significant differences (P < 0.05, χ2 test). C: percentage of cells with significant excitatory (left) or suppressive (right) on-responses for each burst duration (closed circles indicate significant difference from PV− broad cell response, P < 0.05, χ2 test).

