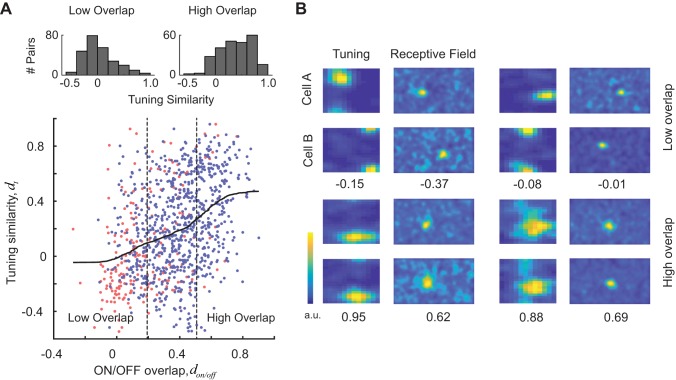
Fig. 2.
Evidence of local tuning bias in mouse primary visual cortex. A, bottom: tuning similarity (dt) is positively correlated with receptive field overlap of both ON and OFF subregions (don and doff). Scatterplot shows tuning similarity against the overlap of ON or OFF subregions. Pairs of cells may be plotted twice, once showing the overlap of ON subregions (red points) and once showing the overlap with OFF subregions (blue points). Solid curve represents a smoothed version of the scatterplot obtained via local regression. Top: histograms of tuning similarity values for pairs with low and high overlap (defined by the vertical, dashed lines). Pairs with high degree of receptive field overlap have a significantly higher similarity of tuning than pairs with low degree of receptive field overlap. #, Number of. B: examples of 4 cell pairs with different degrees of receptive field overlap and tuning similarity. For each pair, the tuning similarity and receptive field overlap values are shown at the bottom. Top row shows examples of cell pairs with low degree of receptive field overlap and tuning similarity. Bottom row shows examples of cell pairs with high degree of receptive field overlap and tuning similarity. a.u., Arbitrary units.

