Fig. 3.
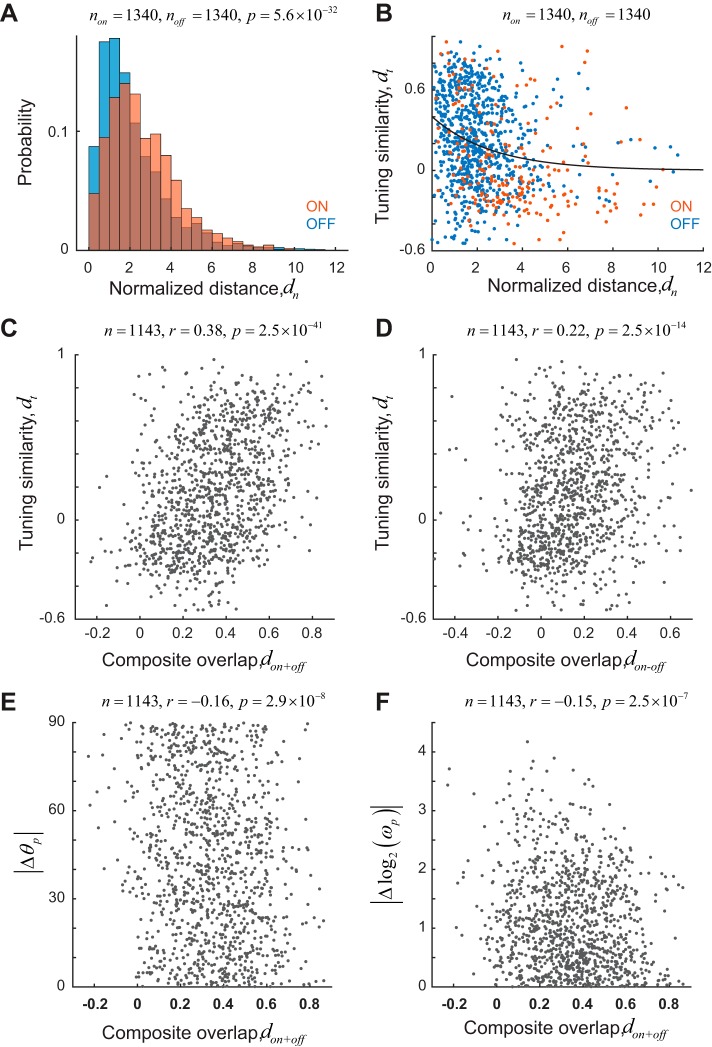
Robustness of correlation between tuning similarity and receptive field overlap. A: distribution of normalized distance (dn), a measure of receptive field overlap, for ON (red) and OFF (blue) subregions for pairs ≤100 μm apart on the cortex. ON subregions show larger positional scatter. B: tuning similarity is inversely correlated with normalized distance. Solid line represents an exponential fit to the data. Receptive fields with overlapping receptive fields tend to have higher tuning similarity than receptive fields that are far apart in the visual field. Blue dots represent OFF subregions. Red dots represent ON subregions. C and D: tuning similarity is correlated with receptive field overlap measures based on the sum (don+off) or difference (don−off) of ON and OFF maps. E and F: absolute differences of preferred orientation (|Δθp|) and spatial frequency [|Δlog2(ωp)|] are correlated with receptive field overlap based on the sum of ON and OFF maps.

