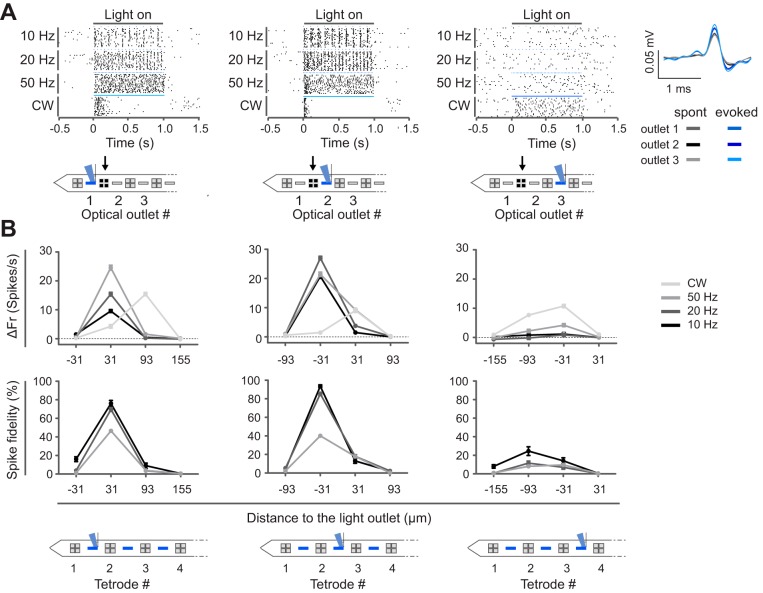
Fig. 4.
Highly localized neuronal activations. A: continuous single-unit recording during sequential activation of one light outlet after another. Spike raster plots are for an example unit recorded at TT2 (indicated with black arrow, activated light outlet indicated in blue). Every stimulation paradigm was repeated 20 times. The waveforms of the light-induced spikes (blue) were identical to the spontaneously occurring spikes (gray) across the different recording sessions (cross-correlation ~99%, quantified during 20-Hz stimulation). B: baseline normalized firing rate (ΔFr; median ± interquartile range of 20 repetitions) and spike fidelity of one recorded unit per TT in TT1–TT4 across all stimulation paradigms (different shades of gray) for a given position of the light outlet (indicated in blue). Reliable spiking in TT2 is only evoked when light is emitted in close proximity, from either light outlet 1 or 2, but not from light outlet 3.

