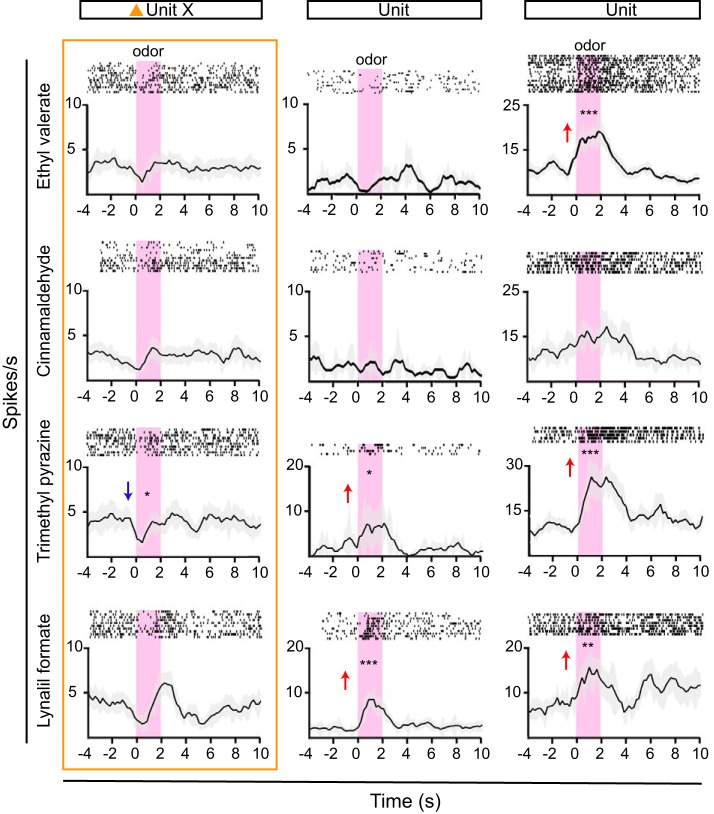
Fig. 7.
Diverse odorant responses in anterior olfactory nucleus neurons of awake, behaving mice. Peristimulus time histograms and spike raster plots of 3 example units and their responses to a panel of 4 odorants are shown. Odorants are presented for 2 s (pink shading). Units responded to specific odorants or multiple odorants with increasing (red arrow) or decreasing (blue arrow) firing rates, compared with baseline (significant responses: *P < 0.05; **P < 0.005; ***P < 0.005. Unit X (orange triangle, same unit as in Fig. 6, B–E) is presumed directly activated and thus appears to reflect an optogenetically identified CamKII+ neuron. This unit appears to be inhibited by odorant stimulation (one-way ANOVA and Bonferroni post hoc test, df = 11, P < 0.05).

