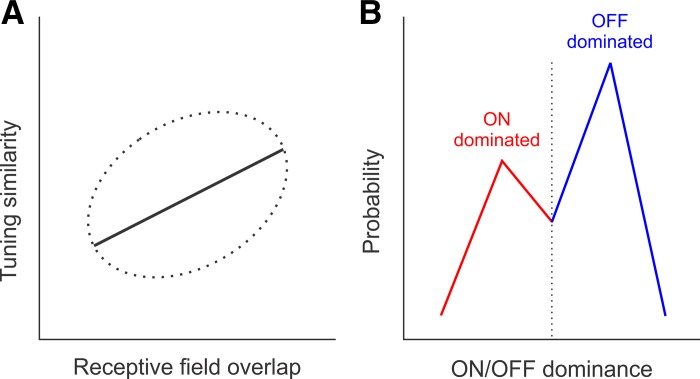
Fig. 1.
Cortical biases in the combined representation of retinotopy with stimulus tuning and dark/light contrast polarity in mouse primary visual cortex (Jimenez et al. 2018). A: cartoon representing a weak but significant positive correlation between tuning similarity and receptive field overlap (the dotted ellipse represents data spread, and the solid line represents the data trend). B: cartoon representing the bias of cortical responses toward dark stimuli. Blue histogram represents the probability of finding a cortical neuron dominated by the OFF pathway (responds stronger to dark stimuli). Red histogram represents the probability of finding a cortical neuron dominated by the ON pathway (responds stronger to light stimuli). Dotted line represents neurons with balanced ON/OFF responses.

